Windows Azure: Telemetry Basics and Troubleshooting
1. Introducing the telemetry blog series
This week we are publishing the first blog post of a long series about the design and implementation of Cloud Service Fundamentals on Windows Azure. This reusable code package demonstrates how to address some of the most common scenarios we encountered working on complex Windows Azure customer projects through a number of components that can become the basis for your solution development. The first component we are presenting is Telemetry. It is a vast topic itself and we decided to break it down into four main buckets, as we described in this introduction.
Our goal for this series of blog entries about telemetry is to guide you throughout the entire journey, from basic principles up to the end-to-end solution we have built in the Cloud Service Fundamentals (CSF) package. As many other “build or buy” scenarios, depending on your specific requirements and resources you might want to implement every aspect of a telemetry solution by yourself or evaluate what is already available on the market. The “App Services” section of the Windows Azure Store will give you an overview of the most common choices we have nowadays in this space. In any case, going through this series will give you a good coverage of key aspects of monitoring and troubleshooting your cloud-based solution.
2. Introducing the basics of telemetry and troubleshooting
In this first post, we consider some of the basic principles around monitoring and application health by looking at fundamental metrics, information sources, tools, and scripts. You can use these to troubleshoot a simple solution deployed on Windows Azure (few compute node instances, single Windows Azure SQL Database instance). This is an elaboration of what you can find on official documentation.
Operating solutions in a Windows Azure cloud environment is a combination of traditional, well-known, troubleshooting techniques and specific toolsets, which reduce the intrinsic added complexity introduced by a highly automated and abstracted platform. When the number of moving parts in a solution is reasonably small, such as a few compute nodes plus a relational database, troubleshooting and diagnostics practices can be easily performed manually or with minimum automation.
However, for large-scale systems, collecting, correlating, and analyzing performance and health data requires a considerable effort that starts during the early stages of application design and continues for the entire application lifecycle (test, deployment, and operations). This is where CSF telemetry component can help you reducing the implementation effort.
Providing a complete experience around operational insights helps customers to meet their SLAs with their users, reduce management costs, and make informed decisions about present and future resource consumption and deployment. This can only be achieved by considering all of the different layers involved:
-
- Infrastructure (CPU, I/Os, memory, etc.)
- The application (database response times, exceptions, etc.)
- Business activities and KPIs (specific business transactions per hour, etc.).
Process, correlate, and consume this information will help operations teams (maintaining service health, analyzing resource consumptions, managing support calls) and development teams (testing, troubleshooting, planning for new releases, etc.).
For large-scale system, telemetry should be designed to scale. It must execute data acquisition and transformation activities across multiple role instances, storing data into multiple raw data SQL Azure repositories. To facilitate reporting and analytics, data can be aggregated in a centralized database that serves as a main data source for both pre-defined and custom reports and dashboards. These aspects will be considered in next posts of this series.
3. Defining Basic Metrics and KPIs
Define key metrics and indicators will immediately tell you the status of your application’s health. Here is an example of a basic set of metrics covering both the infrastructural side and the application side:
3.1. Compute nodes resource usage
Look at the resource consumption of compute nodes hosting your application components is a first step in monitoring or troubleshooting scenarios. Focus on traditional indicators like CPU activity, memory usage, disk usage, network throughput, and latency. While not providing a comprehensive view of your application state, they provides a solid starting point. Opening a Remote Desktop connection to individual compute node instances will be enough for simple deployment. Then use tools like PerfMon, Task Manager, and Resource Monitor to access these performance indicators in real-time while the application is running.
3.2. Windows Event logs
Event logs in compute node instances will give you additional information on overall state of your application and the underlying platform. System and Application Logs will provide indications of issues such as application crashes or system restarts. Aggregate and correlate them with other events from different sources will help during troubleshooting sessions or analyzing trends.
3.3 Database queries response times
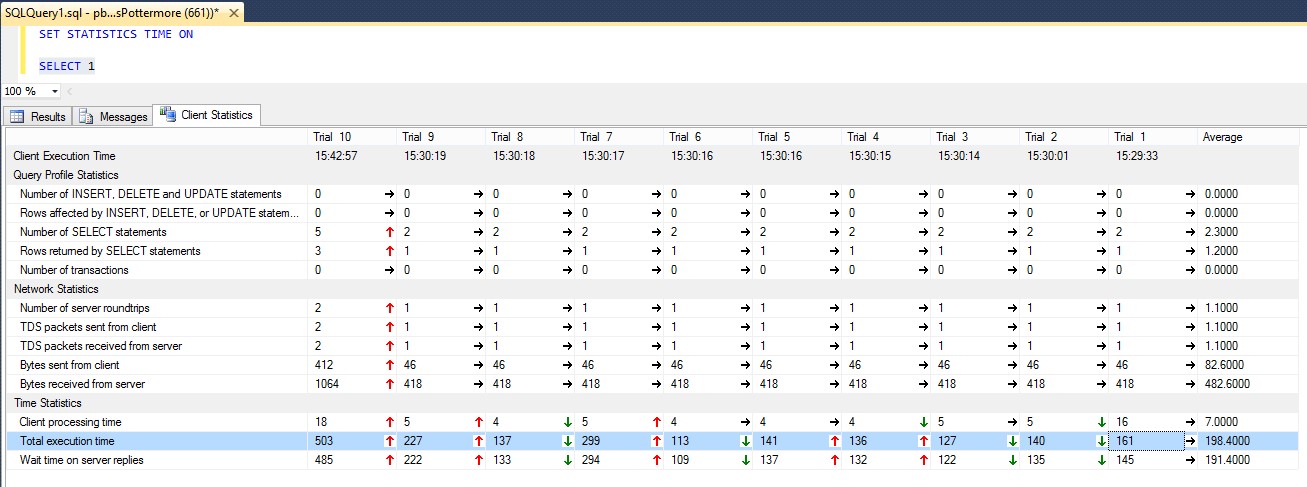
Query response times (or service-to-service interactions) are critical in distributed applications. Interactive workloads are usually very sensitive to database response times and most of the time directly influence end-user experience. Define thresholds and automate the measurement processes is a good practice to understand application behaviors over time. Application instrumentation plays a big role here, and will cover that in the next blog post. You can also use simple tools like SQL Server Management Studio (SSMS) and measure response times directly. The following example shows how to measure the impact of network latency in response times between “on-premises-to-cloud” and “cloud-to-cloud” communications:
Figure 1 - On Premises to Azure SQL Database latency
In the previous picture, we just ran multiple times a simple “SELECT 1” from on premises against an Azure SQL Database instance, with Client Statistics enabled to minimize server execution time, and in the last section “Time Statistics”, you can notice how “Wait time on server replies” is taking most of the time during the round trips.
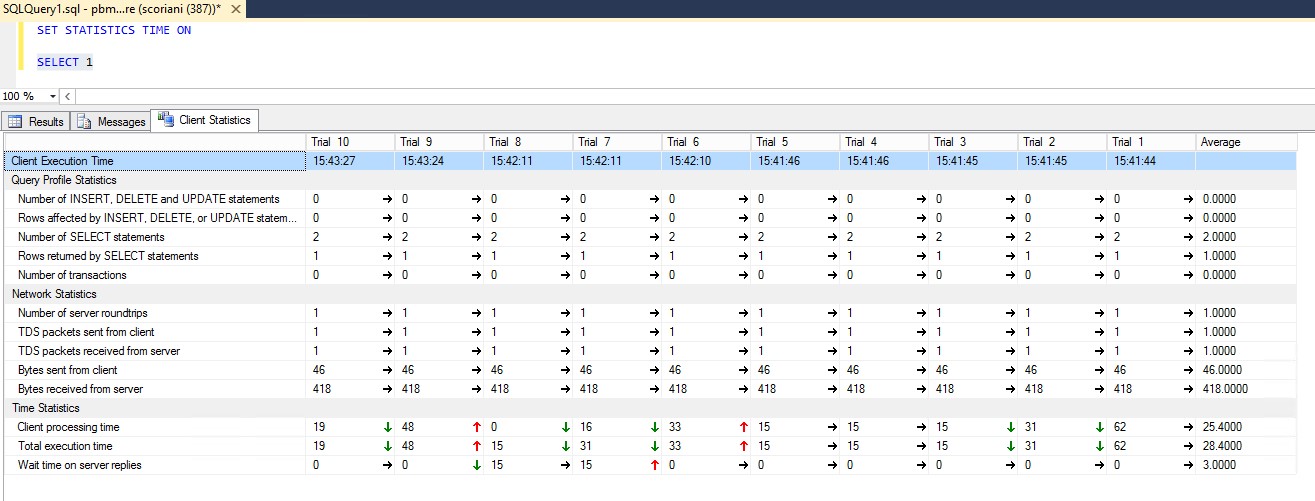
Figure 2 - Azure Compute Node to Azure SQL Database latency
The same experiment repeated with SQL Server Management Studio running on a Compute Node will give us immediately the different experience in terms of latency.
3.4. Application specific exceptions
A high rate of exceptions generated can be indicator that something is going wrong in your application. Temporary malfunctioning conditions may be tolerated in some scenarios, and classified as a transient bump. In other cases, malfunctions should trigger an alerting mechanism and receive immediate attention by operators. It is a recommended approach to establish a monitoring system for application errors and exceptions. This helps with both near “real time” troubleshooting as well as long-term root cause analysis activities.
3.5. Database connection and command failures
A critical subset of application exceptions are database connection and command failures. Transient connectivity issues such as the ones generated by failover or throttling events can happen more often with Azure SQL Database compared to on-premises versions of SQL Server. Sometimes they can be the symptoms for a suboptimal data access layer implementation:
- Improper retry logic during a transient event can lead to surpass the 180 concurrent request limit when the failure is over
- Frequent command execution timeouts may require the adoption of a batching strategy or scaling out the data access layer across multiple backend databases to handle user workload
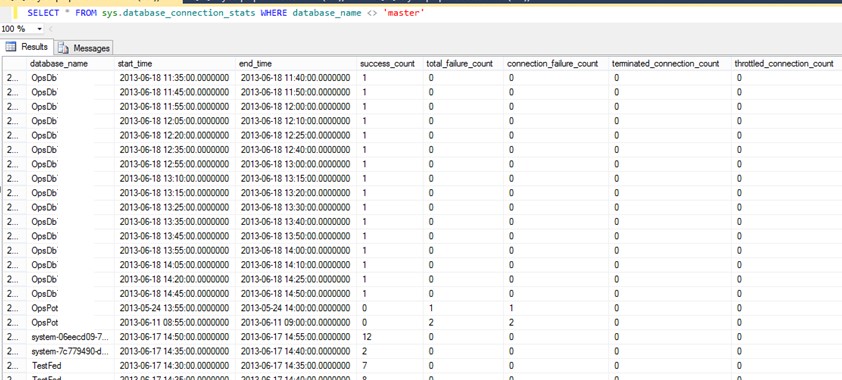
We will introduce how to automate a regular monitoring task to capture these events and correlate application exceptions and server logs in future posts. For simple deployment scenarios, manually querying server level tables like sys.event_log and sys.database_connection_stats (exposed in the master database) as shown in the next pictures will provide an aggregation of potential connectivity issues over the last five minutes.
Figure 3 - Event log table example (SELECT * FROM sys.event_log WHERE database_name <> ‘master AND severity >0’)
Figure 4 - Connection stats example (SELECT * FROM sys.database_connection_stats WHERE database_name <> ‘master’)
At the application level, look for exceptions that involve SqlConnection/DbConnection or SqlCommand/DbCommand in your trace or application logs. This can give you more details on what happened and when the issues occurred.
3.6. Multitenancy effects
Windows Azure is a shared and distributed environment and some degree of application performance variance is expected. Application components in Cloud Service Fundamentals (CSF) package are designed to minimize this variability, but is important to define acceptable thresholds and measure how your application is behaving. Services like Azure SQL Database can be queried to extract how many concurrent users are hitting a database instance at any given time. sys.dm_exec_requests will return concurrent requests and statistics on the most recent reasons for what the system is waiting for resources to complete query executions. High rates of “SE_REPL” wait types, for example, can indicate that the replication system is affecting system’s ability to execute user transactions. Trend analysis on these performance issues are critical during capacity planning and similar important management decision points.
4. Monitoring sources
So far, we have just scratched the surface on some of the most important metrics to consider while starting a monitoring exercise for your Azure solutions. But in this section, we will drill down more specifically into the monitoring features and capabilities of the Windows Azure platform and its key services.
4.1. Windows Azure Diagnostics
Windows Azure Diagnostics (WAD) is the built-in solution offered by the platform to collect and aggregate multiple diagnostic data sources into a single repository (Storage Account):
- Windows Azure logs
- IIS logs
- IIS Failed Request logs
- Windows Event logs
- Performance counters
- Crash dumps
- Windows Azure Diagnostic infrastructure logs
- Custom error logs
Once enabled and properly configured for your service deployment, WAD acquires information from these different sources and stores them locally on each compute node. This happens on a defined interval on the local file system (for more information on this “in-node” architecture, go here). From there, with a different configurable frequency, data can be transferred to a centralized Azure Storage Account for subsequent analysis.
In our CSF package, we heavily rely on WAD to collect diagnostics information from all compute roles included in the solution and to consolidate them into a single Storage Account. This becomes one of the information sources for telemetry data acquisition and transformation pipelines. These pipelines aggregate and correlate diagnostic information into a single Windows Azure SQL Database instance for further analysis.
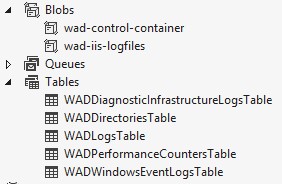
In particular, we are using the most significant Storage Tables and Blobs that are created by the DiagnosticAgent in the Storage Account we configured in the WAD plug-in connection string. The following screenshot shows an example of the standard naming configuration:
Figure 5 Windows Azure Diagnostics Tables and Blob containers
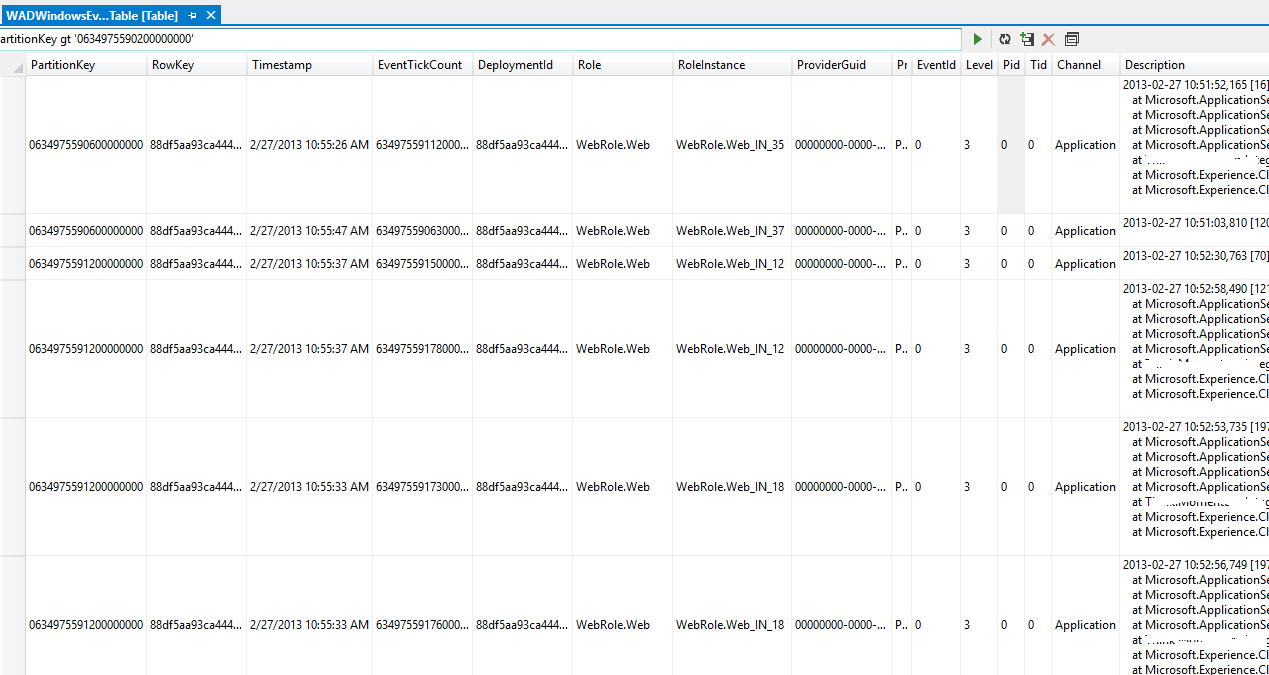
For troubleshooting simple scenarios, you can, of course, manually query these Tables using tools like Visual Studio Server Explorer or third party tools like Cotega or Cerebrata’s Azure Management Studio to extract information that is relevant to your investigation. The following screenshot shows a diagnostic table in Visual Studio Server Explorer.
Figure 6 Windows Azure Diagnostic Event Table
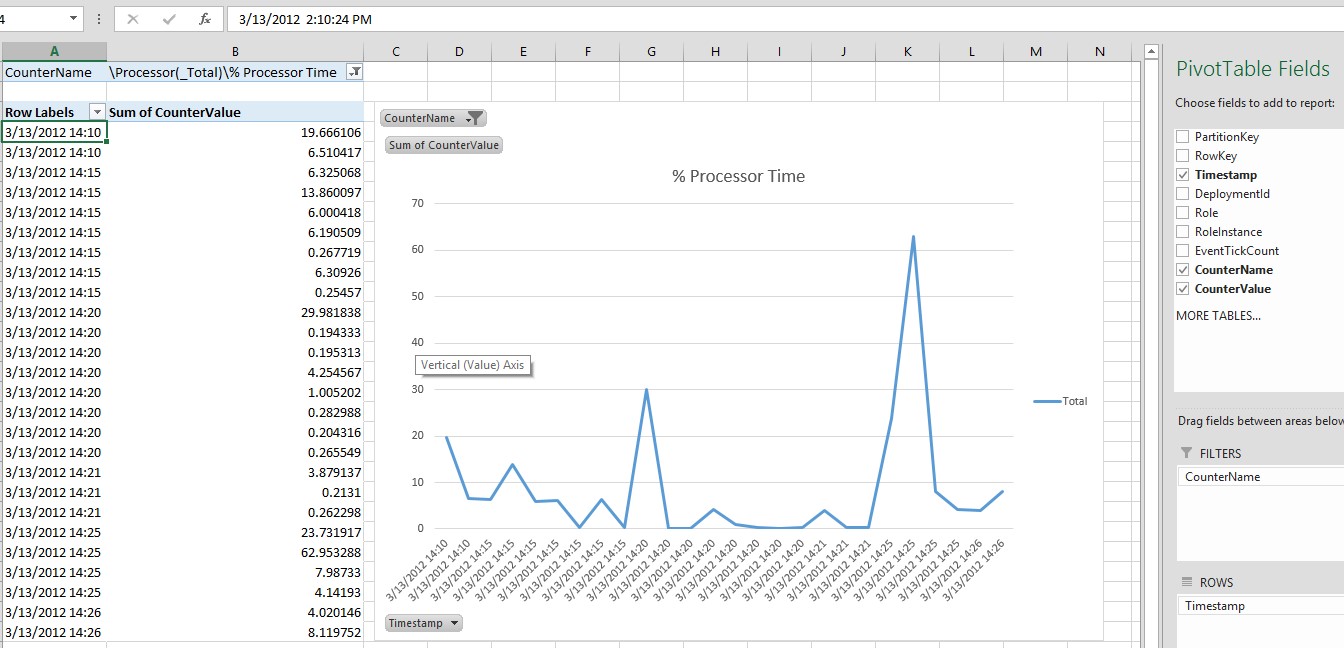
You can also manually download trace logs or performance counter values over a specific time interval when an incident happens to perform further analysis. For example, you can plot this information on an Excel spreadsheet (as shown in the next picture) as an effective way to better understand your application behaviors without the need for a more complex underlying infrastructure.
Figure 7 Customer Excel sheet to analyze Windows Azure Diagnostics data points
4.2. Application instrumentation
Our applications are the greatest sources of information when it comes to monitoring purposes. No matter what tool or approach you take to consume this information, you must first properly instrument your application. Without making instrumentation a high priority design task, you cannot achieve your manageability goals after the application goes into production. Next blog post will be totally dedicated to application instrumentation, from creating custom performance counters to simple trace messages. These can be collected through Windows Azure Diagnostics and used as a stand-alone tool to measure your application metrics. More advanced techniques include generating your own diagnostic events using the EventSource class in .NET 4.5 and integrating these into your application logging strategy using the Semantic Logging Application Block capabilities. Please refer to the next blog post in this series for more implementation details.
4.3. Windows Azure SQL Database monitoring and diagnostic DMVs
Correlate application-side events and metrics with the behavior of your database instances is required for a successful monitoring and troubleshooting strategy. When application response times increase, drill down into database response times for single operations, and look at the query execution plans that database engine was using at that time. This will point you to optimization areas like missing indexes or suboptimal operations. When your application is receiving throttling errors, you might want to check how many concurrent requests are hitting your database at a given time and look at what wait types are impacting your workload.
The article called “Windows Azure SQL Database and SQL Server -- Performance and Scalability Compared and Contrasted” describes some of the differences between traditional SQL Server on premises and Windows Azure SQL Database. “Troubleshooting and Performance Analysis in SQL Database” section specifically presents some of the monitoring and analysis techniques that we adopted in the CSF telemetry package. Specifically, we monitor:
- Database size growth
- Query plans and resource consumption over time
- Wait stats
- Error logs
- Connection statistics
- Missing indexes statistics
In that article, there are T-SQL queries that we have embedded into the automated data acquisition pipeline of the CSF telemetry package. Nothing prevents you from using those queries interactively through SQL Server Management Studio or Windows Azure SQL Database management portal. Manual runs can generate independent result sets during your investigation.
4.4. Windows Azure Storage Analytics
If your solution relies on Windows Azure Storage and one of the programming abstractions (blobs, queues, and tables), you also need a way to monitor your back-end interactions with the storage services.
Azure Storage Analytics is the feature you can enable at the Storage Account level to log the interactions in a hidden Windows Azure Blob container called $logs and Windows Azure Tables containing the aggregate metrics for the three main abstractions:
- $MetricsTransactionsBlob
- $MetricsTransactionsTable
- $MetricsTransactionsQueue
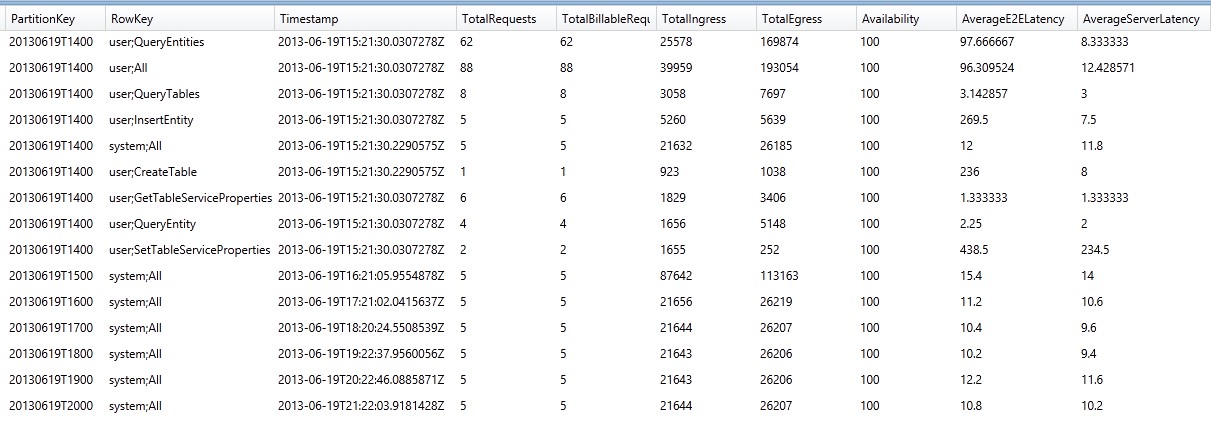
By querying these tables, you’ll be able to extract meaningful information, like the number of requests, end to end latency, and server processing times for operations in a given time interval. See the following table as an example:
Figure 8 $MetricsTransactionsTable in Azure Storage Analytics
You can also drill down into specific calls by looking at the log files collected in the blob container previously mentioned:
Figure 9 Azure Storage Analytics Blob structure
If you look at a single log entry, fully documented here, you will notice important information, such as operation type, status, timestamp, client IP address, end-to-end execution time, and so on.
Figure 10 Azure Storage Analytics log entry format
Again, collecting this information and correlating it with all the metrics captured on the application-side gives you the details you need during your investigation.
5. General analysis approach
Once you have defined your key performance indicators (KPIs) and familiarized yourself with the different diagnostic data sources mentioned so far, your troubleshooting toolset is almost complete. You just need to apply a consistent approach to analyze this information during both normal performance and availability incidents. Here is an approach that worked consistently during our customer engagements:
5.1. Detect
Detect performance issues before end users will be impacted requires a scheduled mechanism in place to poll different data sources and monitors key thresholds, triggering appropriate alerts. But with proper level of instrumentation, data sources we mentioned in Section 3 will give you the ability to drill down into what is happening. Application errors and exceptions are typically a good starting point. To detect all components affected by a specific incident, you might need to interrogate and analyze results from different tools (e.g. Windows Azure Diagnostic logs, Windows Azure SQL Database DMVs, etc.). This is where having a centralized and correlated repository is invaluable in reducing the time-to-detection for application issues.
5.2. Classify issue – transient vs. systemic
Once the issue has been detected, it is important to understand its nature. In a shared, multitenant environment like Windows Azure, some issues can be transient and will resolve themselves. For example, Windows Azure SQL Database load balancing mechanism could move a database from a busy node to a different one, and a throttling incident that happened during that phase can automatically disappear. Other issues can be systemic, like a wrong connection string deployed in production after an application change. In these situations, without a specific intervention from your operations team, the problem will not be fixed. Again, this classification is aided by querying data sources like Trace logs in Windows Azure Diagnostics and looking for specific application exceptions.
5.3. Recover - first priority
In this services world, your first priority should be to recover from an incident and have your application up and running as soon as possible. Once you have developed a strong practice for the steps described in Section 4.1 and 4.2, you will be best positioned to understand the right solution to a given application issue. Most of the times, contacting Microsoft Customer Support Services (CSS) is the fastest choice for all issues that are out of your direct control. But, even then, having the right set of diagnostic data available during your interactions with support engineers significantly speeds up problem resolution. For other cases, the data will show that the issue has been generated by something wrong in your application, and you will have all the information at your disposal to bring your application back to normal functioning.
5.4. Diagnose root cause and mitigate
Root Cause Analysis (RCA) should always complement issue resolution and recovery. With all data collected and correlated from the various sources we mentioned, it will be possible to understand recurring patterns and trends that anticipated a particular incident; for example higher web page loading times can be directly correlated to database response times. This can lead to identifying the root cause such as the underlying query execution time increased due to a suboptimal query plan caused by indexing issues. This kind of RCA will typically lead to long-term mitigation actions that may or may not involve application code changes or general improvements. This virtuous cycle will not be possible without an appropriate diagnostic toolset in place.
6. Tools and scripts
This is a collection of tools and scripts that we have found useful during various troubleshooting processes. Some of these have been integrated into our CSF telemetry package, while others can be used to complement (or replace) that during your investigation.
6.1. 3rd party tools and services
Cotega Database Monitoring for Azure SQL Database
Active Cloud Monitoring by MetricsHub
Azure Watch by Paraleap
Azure Management Studio by Cerebrata
6.2. Microsoft tools and solutions
6.3. Custom tools and scripts (e.g. DMV queries)
- T-SQL troubleshooting scripts in “Windows Azure SQL Database and SQL Server -- Performance and Scalability Compared and Contrasted”. See section “Troubleshooting and Performance Analysis in SQL Database”.
- New sys.dm_db_wait_stats now available to collect all the waits encountered by threads that executed during operations.
- SELECT * FROM [sys].[dm_db_wait_stats] ORDER BY wait_time_ms DESC
- sys.resource_usage provides hourly summary of resource usage data for user databases in the current server. Historical data is retained for 90 days (currently in preview, it will change soon with a lot of interesting new information on resource usage)
- SELECT * FROM sys.resource_usage WHERE database_name = 'Test1' ORDER BY time desc
- sys.resource_stats similar to the previous one, but with 5 min granularity for the last 14 days (in preview as well, it will change)
- SELECT * FROM sys.resource_stats WHERE database_name = 'Test1' ORDER BY start_time desc
The Azure CAT team is developing a client-side tool that will help in automating data collection and correlation for one-off troubleshooting scenarios. This will complement CSF telemetry package and reuse most of the techniques presented in this blog post. Once completed it will be posted here, so stay tuned!!
