SSRS 2008 R2 Atom Data Feeds for PowerPivot
This article focuses on a new feature of SQL Server Reporting Services 2008 R2: enabling data feeds to be exported from a report and consumed in the new SQL 2008 R2 [[PowerPivot Overview|PowerPivot]] client.
With the release of SSRS 2008 R2, we now have a new rendering extension to render Atom data feeds from SSRS reports. You use this extension to generate Atom-compliant data feeds that are readable and exchangeable with applications that can consume data feeds generated from reports. For example, you can use the Atom rendering extension to generate data feeds that you can then use in the SQL Server 2008 R2 PowerPivot client.
The Atom service document lists at least one data feed for each data region in a report. Depending on the type of data region and the data that the data region displays, Reporting Services might generate multiple data feeds from a data region. For example, a matrix or chart can provide multiple data feeds. When the Atom rendering extension creates the Atom service document, a unique identifier is created for each data feed and you use the identifier in the URL to access the content of the data feed.
The way that the Atom rendering extension generates data for a data feed is similar to how the Comma-Separated Value (CSV) rendering extension renders data to a CSV file. Like a CSV file, a data feed is a flattened representation of the report data. For example, a table with a row group that sums the sales within a group repeats the sum in every data row and there is no separate row that contains only the sum.
You can generate Atom service documents and data feeds using Report Manager, Report Server, or a SharePoint site that is integrated with Reporting Services.
In this article you can find:
- Atom Specifications
- Reports as Data Feeds
- Atom Service Document
- Sample Atom Service Document
- Working with Data Feeds
- Consume Atom Data Feed in PowerPivot
- Explore the Features of PowerPivot
- Summary
Atom Specifications
The Atom 1.0 standard describes a pair of specifications for publishing and structuring XML data:
- RFC5023 specifies the Atom Publishing Protocol, which describes service discovery and how paths to a data object are constructed. A data service document (.atomsvc) file created by the Atom rendering extension conforms to the service document definition that this protocol describes. For more information, see Atom 1.0 Publishing Protocol on the IETF Web site.
- RFC4287 specifies the Atom Syndication Format, which specifies how a client-side data reader interprets and presents the data in an application. For more information, see Atom 1.0 Syndication format on the IETF Web site.
Reports as Data Feeds
You can export any existing production report as a data feed, or you can create a report whose primary purpose is to provide data, in the form of data feeds, to applications. Using reports as a data feed gives you an additional way to provide data to applications when the data is not easy to access through client data providers, or when you prefer to hide the complexity of the data source and make it simpler to use the data. Another benefit of using report data as a data feed is that you can use Reporting Services features such as Report Manager, security, scheduling, and report snapshots to manage the reports that provide data feeds.
When rendering reports specifically for data feeds, it is useful to know how the rendering extension identifies data feeds in your reports. For a given report, there is at least one data feed for each data region, but there could be multiple data feeds.
Atom Service Document (.atomsvc file)
An Atom service document specifies a connection to one or more data feeds. At a minimum, the connection is a simple URL to the data service that produces the feed.
When you render report data by using the Atom rendering extension, the Atom service document lists the data feeds available for a report. The document lists at least one data feed for each data region in the report. Tables and gauges generate only one data feed each, but matrices, lists, and charts might generate multiple feeds, depending on the data they display.
The following diagram shows a report that uses two tables and a chart.
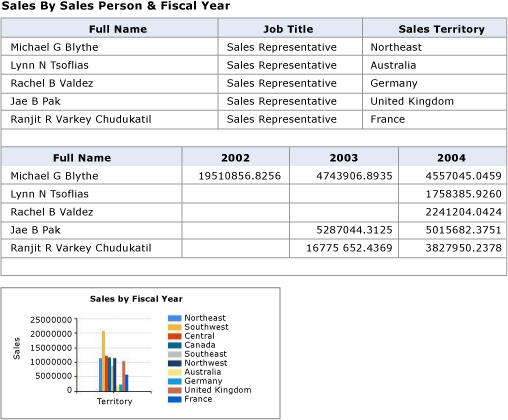
The Atom service document generated from this report includes three data feeds: one for each table and one for the chart.
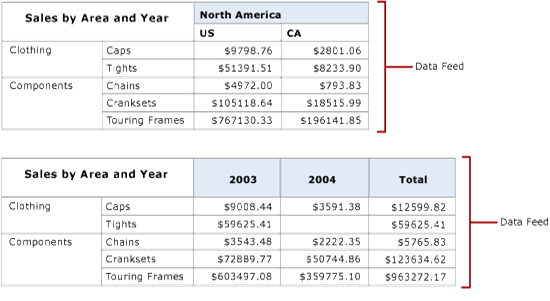
The matrix data regions might have more than one data feed, depending on the structure of the matrix. The following diagram shows a report that uses a matrix that generates two data feeds. This matrix contains parallel groups and therefore produces a feed for each group.

The Atom service document generated from this report includes two data feeds, one for each of the dynamic peer columns: Territory and Year. The following diagram shows the content of each data feed.
Sample Atom Service Document
Let's take a look at what the Atom Service Document looks like under the covers. The following diagram shows a report with one Matrix:

Using Report Manager in SSRS 2008 R2, export the data feed.

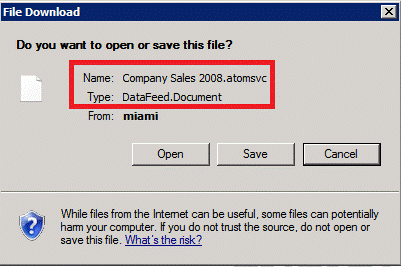
You will notice that saving the Atom Service Document is very quick because at this point we are not executing the report. The Atom Service Document itself does not contain report data.
The Atom Service Document after export:

The service document is simply a pointer to the service that provides the data feed. In this case, it's an SSRS 2008 R2 report on a report server. The document could have multiple data feeds or data regions that are identified in the collections node with an associated title. You can see that it's an HTML hyperlink to the report on the report server with some parameters, specific rendering commands Format=ATOM, and lastly the DataFeed Unique identifier, which will be used by the renderer to identify which data region to render.
Working with Data Feeds
All data feeds generated by the report include the report items that are in scope of the parent of the data region that generate the data feeds. Imagine a report that has several tables and a chart. Text boxes in the report body provide a descriptive text of each data region. Every entry in every data feed that the report generates includes the value of the text box. For example, if the text is "Chart displays monthly sales averages by sales region", all three data feeds would include this text on each row.
If the report layout includes hierarchical data relationships, such as nested data regions, those relationships are included in the flattened rowset of report data.
The data rows for nested data regions are typically wide, especially if the nested tables and matrices include groups and totals. You might find it useful to export the report to a data feed and view the data feed to verify that the data generated is what you expected.
When the Atom rendering extension creates the Atom service document, a unique identifier is created for the data feed, and then you can use the identifier in the URL to view the content of the data feed. The sample Atom service document, shown above, includes the URL http://ServerName/ReportServer?%2fProduct+Sales+Summary&rs%3aCommand=Render&rs%3aFormat=ATOM&rc%3aDataFeed=xAx0x1". The URL identifies the report (Product Sales Summary), the Atom rendering format (ATOM), and the name of the data feed (xAx0x1).
Report item names default to the report definition language (RDL) element names of the report items, and often they are not intuitive or easy to remember. For example, the default name of the first matrix placed in a report is Tablix 1. The data feeds use these names.
To make the data feed easier to work with, you can use the DataElementName property of the data region to provide friendly names. If you provide a value for DataElementName, the data feed subelement <d> will use is it instead of the default data region name. For example, if the default name of a data regions is Tablix1 and DataElementName set SalesByTerritoryYear, then the <d> in the data feed uses SalesByTerritoryYear. If the data regions have two data feeds like the matrix report described above, the names used in the data feeds are SalesByTerritoryYear _Territory and SalesByTerritoryYear _Year.
If you compare the data shown on the report and the data in the data feed, you might notice some differences. Reports often show formatted numeric and time/date data, but the data feed contains unformatted data.
A data feed is saved with the .atom file name extension. You can use a text or XML editor such as Notepad or XML Editor to view the file structure and content.
Consume Atom Data Feed in SQL Server 2008 R2 PowerPivot Client
As mentioned previously, SSRS reports as Atom Data Feeds can be consumed in other applications, making better use of your reports and giving the business-intelligence users much more flexibility with their data. Let's take a look at how easy and powerful PowerPivot can be for consuming data feeds.
[[PowerPivot Overview|PowerPivot]] is an add-in for Microsoft Excel 2010 and can be downloaded from Download PowerPivot for Excel.
Once downloaded and installed, you will notice a PowerPivot tab in your MS Excel client:

Click the PowerPivot Window button to the far left to launch the PowerPivot client. Then open the Atom Data Feed you saved earlier from SSRS by choosing From Data Feed:

When prompted to choose the data feed source, point to the .atomsvc file to be imported, and then click Open:

Click Next in the Table Import Wizard. Notice that the dialogue recognizes the Tablix1, which is the name of the Matrix data region in the report that contains the data feed.

Note: If there were multiple data regions, they would also show in this dialogue box.
From here you can click Preview & Filter or click Finish to import the flattened data into the PowerPivot client for business intelligence analysis.
Once the data is imported, you can see that it's just a flat representation of the Matrix report from SSRS. At this point, you may wonder what is so special about that. PowerPivot is specifically designed with a compression engine to handle much more data and drastically exceed the performance of the traditional MS Excel spreadsheets. Think of PowerPivot as an in-memory SQL Server Analysis Server cube designed for speed and performance. The two have a lot of similarities, which we will see in the next steps.
Explore the Features of PowerPivot
To begin slicing and dicing this data, import the data from SSRS 2008 R2, and then click the PivotTable button on the toolbar as shown below:

When the PivotTable Field Lit opens, notice the options on the right look a lot like traditional pivot tables in Excel. You now have several options for choosing your Fields, Slicers Vertical, Slicers Horizontal, Filters, and Values.

Drag and drop fields into the Horizontal Slicers and Vertical Slicers sections, as well as the Column Labels and Row Labels sections, like this:

The report populates and also adds a great graphical calculator pad, like in the interface on the left of the image below. You can use the calculator pads to dynamically filter the report data by using the CTRL key.
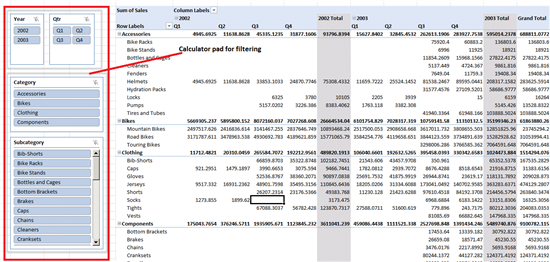
Experiment with the calculator pad by showing data for only 2002, and then remove some of the categories and subcategories.
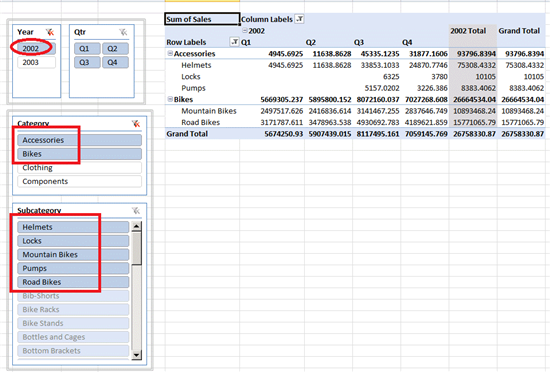
Notice how the subcategories automatically populate, based on the categories chosen. You can also hide row and column labels and just see data values.
Summary
The Atom support in SSRS 2008 R2 and PowerPivot give the BI user even more flexibility than ever. Not only can you produce data feeds from SSRS reports for use in PowerPivot, but you can also consume any REST and Atom compliant feeds in PowerPivot. There are many public data feeds available that can be used and combined with other private sources. The possibilities are endless.
To find some public data to consume in PowerPivot check out this government site here: http://ogdisdk.cloudapp.net/
Check out some other [[PowerPivot Overview|PowerPivot]] and SSRS resources here:
http://blogs.msdn.com/b/powerpivot/archive/2009/09/24/data-feeds.aspx
http://msdn.microsoft.com/en-us/library/ms170438.aspx
See Also
- [[SQL Server Reporting Services]]
- [[PowerPivot Overview]]
- [[SQL Server Overview]]
- Wiki: Technologies Portal