Pushing the Performance Monitor Data into a Database
**Pushing the Performance counters of the Database **
As we know the Monitoring the Performance counters is an important task of the SQL DBA, and even these performance counters are an integral part of the troubleshooting of the performance issues.
And there is interesting way to push the performance counters into the Database of a sql server and from there we can Query them, make views and reports.
Let’s Begin:
1. Making a Data Collector:
First for pushing any perfmon in the database first we need to build a Data Collector set from the perfmon. This Data Collector is going to have the basic performance counters which we want to monitor, Try to keep them as few as possible, so let us be more specific on our requirements(for TempDB Analysis, DB Analysis, Server Health Analysis) and then populating them accordingly. Then determine the intervals at which we need to populate (on 15, 30 seconds basis or minute basis).
You can follow the below link for getting more details on how to create a Data collector sets in the Performance Monitor.
http://technet.microsoft.com/en-us/library/cc749337.aspx
**2. Making a System DSN
**Now for pushing this Performance Monitor from the blg file to the Database we need to create a System DSN from the ODBC of the server. You need to select the Database where you are going to push the perfmon. Preferably host the database over a staging instance and where all the performance data of the production servers can also be pushed.
**3. Running the relog Command
**The relog command is used for re-logging the existing log files into another format. During the re-logging along with the change of format we extract time-specific, counter-specific or both data.
Now as we are logging only a few counters we can execute the command
relog “<The BLG file>” –f SQL –o SQL:<SYSTEM DSN NAME>!<Server where Database is present>
Example: relog C:\ImportantPermon.Blg –f SQL –o SQL:PerfmonDSN!*RTMVDB01\STGSQLINSTANCE
*
After the execution of the above command the relog command determines the no of samples in the blg file and pushes them into the database
4. Query from the SQL
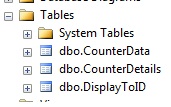
Now after the relog command is executed we can see that three tables are created in the database

Now the performance counter data and values is stored in the table dbo.CounterData and the Counter Details are stored in the table **dbo.CounterDetails. ** But if we select the values from the dbo.CounterData the data it gives is difficult to analyze as the Date and Time both mixed come up as a string, the description of the counters is present in dbo.CounterDetails.
So we can create a simple view like which will relate both the tables
CREATE VIEW [dbo].[Bestview]
AS
SELECT LEFT(dbo.CounterData.CounterDateTime, 10) AS Date, SUBSTRING(dbo.CounterData.CounterDateTime, 12, 8) AS Time, dbo.CounterData.CounterValue,dbo.CounterDetails.MachineName, dbo.CounterDetails.ObjectName, dbo.CounterDetails.CounterName, dbo.CounterDetails.InstanceName
FROM dbo.CounterData INNER JOIN dbo.CounterDetails
ON dbo.CounterData.CounterID = dbo.CounterDetails.CounterID
After this view is created, we can use this view to get a systematic info like in the below format

So we can see above we can get the Counter Value along with the Date, Time. In a similar manner we can multiple views over the Tables to extract Data which will be very helpful for our analysis as well as reporting.
How does this Help in setting up an Analysis?
As we have seen that after we make the Data Collector, we run the relog command to push the data into the perfmon. For doing this on an automated basis we can just create a simple batch file which will start/stop the perfmon, push the data to the Database. And this batch can be scheduled using a Windows Task.
Now here we set the properties of the Data Collector set such that it overwrites the same file once it starts again. So in the batch file we had to just specify a single log file name which used to be pushed into the DB get overwritten by the Perfmon.
Advantages of this Method:
** **Using this Method is very helpful when we want to monitor a set of values for a few days, or generate reports based on these values.
As an example I used this method to generate reports over the TempDB by collecting the data of a specific SQL counters during the peak hours of usage and stored in TempDB. And then connected the Database where is stored the Data from my Excel and got excellent reports of my TempDB performance. Please note that on this overall time I have stored the Production performance counter Data in a Database present in the Staging Server and then queried it. I never touched the Production SQL instance.
One More Example:
For our Team we were observing that every day at a specific time say midnight 11 PM there was a huge spike in the CPU. So what we configured a Data collector set which contains just two objects Processor (_Total) : % ProcessorTime and Process(*): %ProcessorTime. We set the Data Collector properties to get overwritten and made a job to start and stop the Data collector set after one hour and after that push the log file into the Database.
And then we queried using the Table and found out the processes taking the huge amount of CPU by ordering them by the value and then found out that the culprit at that time was the antivirus.