Note
Access to this page requires authorization. You can try signing in or changing directories.
Access to this page requires authorization. You can try changing directories.
Introduction
This article has the following goals:
- Explain what the add-ins are, how they differ, and how each is intended to be used.
- Describe how to install PowerPivot for Excel and the [[Data Mining]] Add-ins for [[SQL Server 2008]] on the same computer. Provide troubleshooting and configuration tips.
- Describe performance issues and other considerations; suggest ways to optimize the use of PowerPivot in conjunction with data mining.
 |
This topic is a how to. Please keep it as clear and simple as possible. Avoid speculative discussions as well as a deep dive into underlying mechanisms or related technologies. |
Overview of Data Mining with the Add-Ins
The Data Mining Add-ins for SQL Server 2008 is a free download that can be used with either Excel 2007 or Excel 2010. When you use the data mining add-ins, you can connect to an existing instance of SQL Server 2008 Analysis Services and use the data mining algorithms and services provided by that server to perform data mining on the data in your Excel workbook and other supported data sources.
The Data Mining Add-ins for SQL Server 2012 can be used with either Excel 2007 or Excel 2010. You can connect to instances of SQL Server Analysis Services 2008, 2008 R2, and 2012. You can connect to early versions to obtain data, but you must use use the data mining algorithms and services provided by Analysis Services to perform data mining on the data in your Excel workbook and other supported data sources.
The Data Mining Add-ins contain two sets of tools: the Table Analysis tools, which let you perform analysis by using wizards and your data in Excel, and the Data Mining Client for Excel, which provides an easy-to-user interface for building data mining models.
- Start with the Table Analysis tools if you are new to data mining.
- The Data Mining Client includes easy to use wizards, but is also a popular tool with experienced data mining developers, because it provides tools for testing data mining models, and lets you quickly and easily try out various multiple models before committing to development and deployment of a model in Business Intelligence Development Studio.
PowerPivot for Excel is an add-in for Microsoft Excel 2010 that lets you combine data from disparate sources in an in-memory relational model. You can then create sophisticated analyses based on formulas, and present the results in interactive PivotCharts and PivotTables.
PowerPivot for Excel is a tool that is designed for rapid exploration and analysis. With PowerPivot, you can slice, dice and summarize large amounts of data. However, you have to know what you are looking for, whereas the Data Mining add-ins support a different type of analysis: namely prediction, what-if scenarios, goal-seeking, and other types of analytics that require inference of patterns from data. Therefore, the two add-ins are best seen as complementary tools that support different aspects of analysis.
Installation
As of 2012, both the Data Mining Add-ins for Excel and PowerPivot are available in both 32-bit and 64-bit versions. To use both add-ins on the same computer, you must install the same version (same bitness) of both add-ins. Each version requires the corresponding version of Excel. That is, you cannot install a 64-bit version of Excel and then the 32-bit version of the add-ins.
If you must install an earlier version of the Data Mining Add-ins for Excel, you must have the 32-bit version of Excel 2010, and the 32-bit version of PowerPivot for Excel.
We recommend that you install the 64-bit versions of both add-ins (as well as the 64-bit version of Office 2010) to optimize the PowerPivot experience.
** **
Prerequisites
.NET Framework: If you are running a version of Windows other than Windows 7, you will need to download and install .NET Framework 3.5 SP1.
SQL Server 2008 Data Mining Add-Ins for Excel: The 2008 Data Mining add-ins can be used together with the following versions of Excel:
- 32-bit version of Microsoft Office 2010
- 32-bit version of Microsoft Office 2007
Note: There is also a previous version of the Data Mining Add-ins for Excel that is designed to be used with SQL Server 2005. SQL Server 2005 does not support new data mining features such as automatic creation of training and testing data sets, model filters, and the new time series algorithm. If you have SQL Server 2008, you should use the 2008 version of the Data Mining Add-ins. You can still use data stored in a SQL Server 2005 database as a data source.
SQL Server 2012 Data Mining Add-Ins for Excel: This update includes a 64-bit version. Be sure to install the same bitness as your version of Excel:
- 32-bit or 64-bit versions of Microsoft Office 2010
- 32-bit version of Microsoft Office 2007
PowerPivot for Excel: The PowerPivot add-in requires Office 2010.
Excel Starter Edition: The following limitations apply to Excel Starter edition:
- Neither the Data Mining Add-ins nor the PowerPivot add-ins is supported for use with the Excel Starter edition.
- In Excel Starter edition, you can view PivotTables but not modify them.
- There is no 64-bit version of Excel Starter.
Side-by-side installation: You can install Office 2007 and Office 2010 on the same computer, but the versions must both be 32-bit versions of Office (x86). In other words, you cannot install 64-bit and 32-bit versions of Office on a single operating system. In general, we recommend the 64-bit version for increased performance.
Installing the Data Mining Add-ins
The following link provides download and installation instructions for the Data Mining add-ins for Excel and for SQL Server 2008.
Data Mining Add-Ins for Office 2007
The following link provides download and installation instructions for the Data Mining add-ins for Excel and for SQL Server 2012. Note that if you have this version, you can also connect to servers running SQL Server 2008 and SQL Server 2008 R2.
SQL Server 2012 Data Mining Add-ins for Office 2010
Installing PowerPivot for Excel
The following link provides download and installation instructions for the PowerPivot client for Excel (v1).
PowerPivot for Excel 2008 R2
The following link provides download and installation instructions for the PowerPivot client for Excel (v2).
PowerPivot for Excel 2012
Performance and Memory Considerations for 32-bit vs. 64-bit Versions
This section describes performance differences between the 32-bit and 64-bit versions of Excel 2010, in case you are trying to decide which version to install.
If you use the SQL Server 2012 Data Mining Add-ins for Excel, you can use a 64-bit version of both PowerPivot and the Data Mining add-ins.
Memory: The limit for memory usage in the 32-bit version of Excel is 2GB. If you need to use more than 2GB of memory to work with your model, you must use the 64-bit version of Excel with the 64-bit version of the PowerPivot add-in. Remember that actual working memory might be less than 2GB, because your workbook and your PowerPivot model must share working memory with Excel’s own processes, runtime stacks and other data structures, and any other add-ins included with Excel besides PowerPivot. Typically Excel and PowerPivot cannot use all the system resources.
Performance: In general, there is little performance difference between 32-bit and 64-bit environments on the PowerPivot client. If you are deciding whether to use a 32-bit version to accommodate use of the Data Mining add-ins, performance should not be considered a major factor.
Data limits: If you are using the 32-bit version pf PowerPivot data to enable concurrent use of the Data Mining add-ins, you may not be able to add as many rows to your tables as you would in the 64-bit edition. If your data fits comfortably within the 32-bit address space, the workbook should open and save without problems. However, some workbooks may become too large to open on a 32-bit system. When using the 32-bit edition of PowerPivot and Excel 2010, the largest workbook with embedded PowerPivot data that you can open is about 300-400MB. If you open a workbook that requires more memory space than is available, the following message appears:
Embedded Analysis Services Engine: Could not load embedded PowerPivot data.
To resolve this problem, you can try removing unnecessary columns from the workbook. For example, text columns typically take up far more space than numerical data, because they are longer, tend to have more unique values, and are less easily compressed. You might also change the filters on the data source to import only the rows that are needed for the current analysis.
For tips on maximizing compression, and determining which columns are using the most memory, see the links in the Resources section.
Publishing workbooks: If you publish your PowerPivot enabled workbooks to a SharePoint server, you must plan for the fact that the integrated instance of Analysis Services on the SharePoint server is always 64-bit. Therefore, for you to publish workbooks developed in a 32-bit environment, the server administrator would have to provide a 32-bit version of any data providers used by your workbook. If there are no 64-bit versions hosted on the server, then both 32-bit and 64-bit workbooks will use the 32-bit providers, and there will be no conflict.
If there are existing 64-bit providers that are preferred for use with PowerPivot, you might not be able to use the instance of PowerPivot hosted on the server to perform scheduled data refresh. In that case, you can use the 32-bit data providers included with the client to do all data refreshes manually on your own computer, and then upload the refreshed workbook to SharePoint.
At the time of this writing, most vendors have only a 32-bit version available, and have not published a 64-bit version yet. However, you should see your system administrator to determine whether there is any potential conflict with 64-bit providers.
Technical Considerations
This section briefly discusses aspects of product architecture, and provides various technical tips that might help you better understand how to integrate the two-addins.
Data Stores for the PowerPivot and Data Mining Add-ins
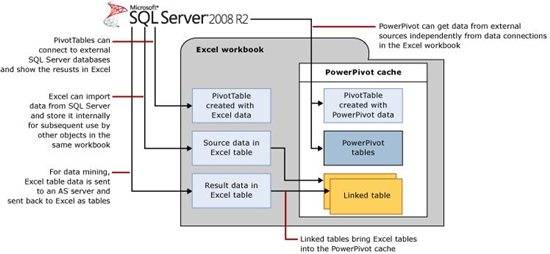
To effectively use data mining with PowerPivot, it is important to understand that the data in a PowerPivot-enabled workbook can be regarded as a separate but potentially related data store:
Data stored by the PowerPivot engine: The data is loaded into memory from various relational or flat file sources, and is saved to disk as necessary, but is not part of the traditional Excel workbook.
Data that you work with in Excel worksheets, in ranges or tables: Data that is stored in the traditional Excel working set can be added to your PowerPivot data store by creating linked tables. Data that you do not explicitly add to the PowerPivot data store remains in the Excel workbook and is not accessible to PowerPivot.
Data from external sources: Both a standard Excel workbook and a PowerPivot-enabled workbook can contain data obtained by other data sources. In Excel, you get data from other sources by using the options in the Data tab. Data that you obtain this way is stored in the workbook as a local copy, until you choose to refresh it by using the menu options in Excel.
When you are using the PowerPivot add-in, you can also obtain data from external sources by using the import wizards on the Home tab of the PowerPivot window. Data that you add to the workbook by using the PowerPivot window is imported into memory and becomes a part of the PowerPivot data store. You can access this data to build PivotCharts and Pivot tables from the PowerPivot modeling window.
Note, however, that PivotTables that you build in PowerPivot are not identical to PivotTables built via traditional Excel. You use different menu options to create them—one in Excel, one in PowerPivot --and the PivotTables use different data stores. Moreover, data from external sources is loaded into each data store by using different providers.
Combining PowerPivot and Data Mining Data
Although both PowerPivot and Excel data are found within a PowerPivot-enabled workbook, the Data Mining Add-Ins work only on Excel tables, and cannot access the data stores used by PowerPivot. This is because PowerPivot uses a highly compressed in-memory relational data store, and does not use the same object model as data that you manipulate by native Excel applications.
The Data Mining Add-Ins can use external data that you connect to by using Excel’s data connection features, and can use data in Excel tables, regardless of whether that source data comes from a cube, Excel data in ranges, or tables linked to external data sources such as Access or SQL Server. You can also connect to PowerPivot workbooks that have been published to SharePoint, because the internal PowerPivot data is hosted on an instance of Analysis Services.
Linked Tables can be used by a PowerPivot model, even if the associated source tables remain in Excel. This is one convenient way to “share” data among PowerPivot applications and the Data Mining add-ins.
In summary.
- Data mining uses the traditional Analysis Services engine, running in MOLAP mode, for accessing and processing data. PowerPivot for Excel uses the new xVelocity data store (VertiPaq).
- Data that is stored in a VertiPaq data store (that is, internally to an Excel workbook and not published to SharePoint) cannot be directly accessed by the Data Mining add-ins. In other words, data that you import into your workbook by using the PowerPivot wizards cannot be used for data mining unless you publish it to SharePoint.
- If you publish your PowerPivot workbook to SharePoint, the data is actually stored in an instance of Analysis Services hosted in SharePoint, and it is possible to use this data if you have access to the instance.
- You can use data from any Analysis Services instance as a data source for building a data mining model. That includes both cubes and tabular models. Typically the data must be accessible as a flattened Excel table. (Note: the DM Add-ins for Excel don't support OLAP mining.) In other words, you can export a flattened slice of a cube or a tabular model to Excel for use in building a data mining model.
- You can use Linked Tables to copy tables into the PowerPivot cache. This is one way to get data mining results into a PowerPivot model.
Saving and Publishing PowerPivot Workbooks
The following additional restrictions may apply when you save a PowerPivot-enabled workbook, or when you publish the workbook to a SharePoint site:
- When you create a data mining model by using the Data Mining Add-ins as client, the actual model is never contained in the workbook, but is either temporary and thus deleted when you exit Excel (a session model), or is saved to an Analysis Server server running in MOLAP mode. Even if your model is stored on an instance of SSAS, other SharePoint users might not have access to the underlying SSAS server. However, any results or charts that were created in Excel based on the data mining model are stored in the Excel workbook and will be accessible to all users.
- When you save the workbook, Excel assumes that the file should be saved with the default file name extension, .XLSX. However, in some regions, the default file name extension is set to ODF (Open Document Format), which does not support PowerPivot data. If you save the workbook to ODF or to another format that does not support PowerPivot (such as CSV, TEXT, or older versions of Excel), your PowerPivot data will not be saved with the file and will be inaccessible even if you reopen the workbook.
- When you publish a PowerPivot enabled workbook that contains charts and reports based on a data mining table or model, the reports should be considered static. The data sources used in the mining model cannot be automatically refreshed, so if the data changes and you need to update the model, you must manually refresh the data in the workbook, and then rebuild the model and republish the workbook.
Working with Cubes
Many people conceive of PowerPivot data as a cube that sits in a workbook. Although it is true that the PowerPivot relational store is based on a highly specialized and optimized version of the Analysis Services engine, the PowerPivot for Excel client does not support many operations that are possible with traditional cubes, including data mining and certain kinds of queries and processing. For working with cubes and building complex data mining models, we recommend that you use BI Development Studio.
If you import data from a cube into a PowerPivot workbook, the data is always imported in flattened form. It makes sense to flatten data if you are working with a small subset, but if you add too many levels of grouping the resulting table can be too large to work with easily and can exceed the memory limit described earlier.
If you import data from a cube into Excel by using the Analysis Services provider, for use in building a traditional PivotTable, note that you cannot use that data for data mining, unless you copy and flatten the results. For example, you might browse your cube in a PivotTable on one worksheet, and on another worksheet, create a separate data connection using the Connections button in the Data Mining toolbar to import cube data for data mining.
Thus, it is possible in a PowerPivot-enabled workbook to have separate three connections to the same cube data source: one connection used for a traditional PivotTable experience in Excel, one connection used to obtain data for further manipulation by the PowerPivot engine, and one connection to get data for use in creating data mining models.
This is not as strange as it sounds, when you consider the richness and complexity of cube data, and the fact that cubes cannot be altered by any of these clients. With each tool, you have a different purpose in mind and manipulate the data in different ways to provide new insights.
Working with Nested Tables
Nested tables are basically equivalent to one-to-many joins that embed related data in a single cell, and are a powerful feature in SQL Server Data Mining because they enable multiple attributes for each case. These structures are easy to create in PowerPivot by using relationships or DAX formulas, and therefore PowerPIvot seems like an ideal fit for data mining.
To create mining models in the Excel Add-ins that use nested tables, you must either flatten the data from the nested tables and save the data to an Excel table, or use the following workaround.
- In the Data Mining Query Wizard, on the Select Source Data page, select the option, External data source.
- Leave the text box for Data source name empty, and paste in the text of a nested table query.
This workaround can be used in any dialog box where you define an external data source.
Note: Although there is no hard limit to the number of nested tables that can be specified in a data mining query, if you add too many nested tables, the number of attributes may increase and exceed the amount of memory needed for processing the model.
Integrating Data Mining with the PowerPivot Add-in
This section describes some strategies for integrating use of the Data Mining Add-ins with PowerPivot for Excel, to illustrate how the two add-ins reinforce and complement each other. You can also view some walkthroughs of each scenario.
This section provides discusses the following questions:
- If PowerPivot and data mining are both BI, how does BI differ from data mining?
- Why can’t we use PowerPivot data for data mining? Isn’t more data always better?
- What is the best way to integrate PowerPivot for Excel with data mining? How would you use the two together?
How BI is Different from Data Mining
In most cases, when people talk about business intelligence, no prediction or hard math is involved. Instead, intelligence is derived from structuring data or adding relationships to make data easier to browse and discover. Whether that data is browsed and manipulated in a cube or in a spreadsheet, the intelligence comes from the knowledge worker or analyst who understands how to look at and interpret the data.
Data mining, on the other hand, is designed for finding patterns that are not readily apparent via exploration. The algorithms provided in SQL Server Data Mining have all been developed and used by academia and the broader data mining community to discover insights that might otherwise go unnoticed. Sure, such patterns might be discoverable by traditional BI if you looked long enough! But patterns can missed for many reasons:
- They involve many interactions, which are too complex for easy detection in a graph.
- The size of a statistically significant effect can be hidden in large data sets, or obscured by other interactions or trends in the data.
- Visualization is not possible, or is too complex to made sense of. Often people need to simplify a problem to understand basic patterns and infer meaning.
Another important way that data mining provides extra insight is by returning statistics that quantify relationships found in the data and that help put trends into perspective. Exploratory BI can also be made to provide measures of relative importance, but only if you take the effort to create the calculations. With data mining, each algorithm generates a rich set of statistics based on mathematical analysis, and these statistics can also be used to assess the validity of projections.
In short, data mining excels at identifying statistically meaningful trends in complex data, and supports those insights by providing statistics that help you interpret the meaning of the patterns that are found.
However, data mining is similar to traditional BI in that the user must contribute much to the analysis. In fact, users of data mining tools must be especially vigilant for bad data that can affect results. For example, as you begin to work with these tools, you will encounter problems such as overfitting and collinearity that were previously the concern only of statisticians.
Users of the data mining add-ins must also spend time understanding the results, lest you use conclusions without understanding them. Fortunately one of the best tools for interpreting the insights of data mining is Excel, and the PowerPivot add-in enhances Excel’s ability to investigate, back up, and support the findings of data mining. The walkthrough provides one example of how you might do that, and provides links to other examples.
How Much Data is Enough?
When people think of data mining, they often think it requires millions of rows of data, or terabyte-size data stores, which are too complex to be easily viewed or understood. In that sense, PowerPivot, with its capacity to quickly load and filter millions of rows of data, seems a natural fit with data mining. After all, isn’t more data always better?
In practice, no. There are lots of reasons why more data is *not* always better.
"Algorithms learn from data and, generally, feeding them with more data will improve the accuracy. This improvement, however, is asymptotic. If the training data is statistically representative of the problem space, then a classifier will stop learning after a certain limit: new data points will support existing patterns and will help reducing the risk of over-training, but will not add more information to the model." [MacLennan, 2009]
Another danger with too much data is that the data can contain errors that skew the results, but typically you cannot afford to visually inspect millions of rows. Data mining provides statistical tools to assess the success of a model, such as cross-validation and classification matrices , and scoring methods such as lift charts and ROC curves. However, no mathematical solution can completely solve the following common problems:
- Bad data: Duplicate values, missing values, and entry errors. These values can create clumps of bad data or appear as outliers, all of which can distort statistical patterns, or cause a model to fail entirely.
- Noisy data: Data contains many discrepancies that “throw off” the hunt for a pattern. And when you combine heterogeneous data sets, discrepancies from each set of data can lead to a huge number of unique values. Ideally you want to collapse these messy values into a single attribute, or to categorize the discrepancies to find patterns. Such cleaning and categorization can be costly, and you must tailor it to your business needs.
- Bad distribution: Data from combined sources might contain too many cases of one kind, or too few cases of the target type. To sample data correctly you might need to merge sources first.
- Too much information: Even in smaller data sets, algorithms can find multiple paths or patterns. In large data sets, the problem is worse. Although most data mining algorithms provide automatic feature reduction, to get the best results you must often collapse values into categories. Choosing the right level of categorization generally requires manually reducing the number of categories, or choosing only the most meaningful categories. But which are those? Sometimes you need to do pattern analysis just to identify the "sweet spots" for further analysis.
- Collinearity: A second type of “extra information” that poses a particular problem for data mining is when the data contains multiple columns that might be closely related or even derived from each other, which can lead to false correlations. With PowerPivot, it is very easy to create calculated columns, which could exacerbate this problem.
- As this short list of pitfalls illustrates, obtaining a large volume of data that you can work with at lightning speed does not enable instant hands-free data mining, even if data is fairly clean.
PowerPivot is useful in that it provides you with a tool that can work efficiently with data, which you need to evaluate, understand, and clean before using it as a candidate for data mining. No matter which tool you use, you must be selective about the data you use. Finding patterns in the data remains an art that is part data preparation and understanding, part statistics, and part interpretation.
Scenario: Using PowerPivot to Reinforce and Complement Data Mining Insights
There are several approaches that you can take when building data mining models and exploring the data with PowerPivot and Excel.
Create your data set using PowerPivot
- Load all of the related data into PowerPivot.
- Build some PivotTables and charts to explore the data.
- Through analysis identify data for data mining.
- Selectively copy just the target data into Excel.
- Build a data mining model.
This approach represents a good practice for data mining, since you are likely to want to build multiple related models and compare them.
MVP Mark Tabladillo has published a series of videos that demonstrate using PowerPivot to collect and summarize data, and then using the Data Mining Add-ins to discover patterns.
http://www.marktab.net/About/PowerPivotandDataMining.aspx
Model using data mining then explore using PowerPivot
- Start with a smaller data set that you trust in Excel, or connect to a cube or relational data source.
- Build a data mining model to discover insights.
- Share the data into PowerPivot via Linked Tables, to mash-up data mining insights with the source data.
Analysis Services PM Kasper DeJonge has built an extended example that demonstrates, among other things, using predictions in a PowerPivot model to help enrich a business scenario and explore it all using Power View.
http://www.powerpivotblog.nl/tutorial-optimize-a-sample-powerpivot-model-for-power-view-reports
Walkthrough
The following walkthrough illustrates the use of linked tables, PowerPivot, and the Data Mining Add-ins for Excel. This example uses the data on the Associate tab, together with the Market Basket tool, to create a mining model that analyzes products and then makes recommendations. After generating the recommendation, PowerPivot is used to add more data, to enrich the analyses and support the recommendations.
Introducing the Sample Data
The data used for this scenario is from the workbook of sample data that was provided together with the SQL Server 2008 Data Mining Add-ins for Office 2007. This sample data set was constructed so that you can easily experiment with different model types.
However, in the course of exporting the source data to Excel, some irregularities were introduced... key columns had been lost or older values were substituted by mistake. Sound familiar? Fortunately PowerPivot makes it easy to create new columns and devise workarounds for incomplete or mis-keyed data.
(Note: this walkthrough was created for the v1 release of PowerPivot. Some features have changed since then.)
Creating the Data Mining Model and Data Mining Reports
Open the sample workbook to the Associate tab, and click anywhere inside the table.
Click the Shopping Basket Analysis tool, on the Table Analysis tools tab, to start creating an association model, which is often used for market basket analysis.
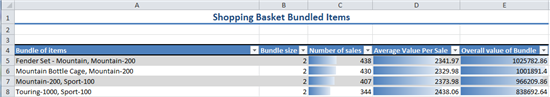
The Shopping Basket Analysis tool rather quickly creates two reports.
One report shows the bundles, meaning the set of products that are frequently purchased in a single customer transaction.
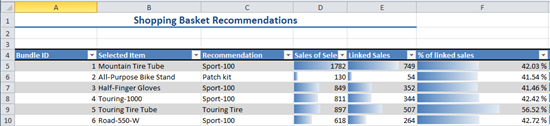
The second report shows recommendations that you can make to customers who buy one item of a bundle. The recommendations are based on probabilities calculated by the data mining model, given the data in your Excel table.
After viewing these reports, you decide the recommendations are potentially of value, and you intend to suggest that the company’s e-commerce site be modified to automatically suggest bundles for customers. To support this proposal, you will provide some additional analysis, by calculating the profit margins for each bundle, and showing the sales for the selected and recommended products.
Using the Data Mining Reports with PowerPivot
The results of all data mining wizards are stored as Excel tables. Therefore, you can simply convert each table to a Linked Table to view the data mining results in PowerPivot. However, conversion to a Linked Table alone will not enable you to calculate sales. You will need to add some columns, add some related data, and create some relationships.
- Add sales for the bundled products
- Add a table of product IDs
Import sales data
Import FactInternetSales, which is the table containing detailed sales data for the products, by using the PowerPivot Table Import Wizard. For reference purposes, also import DimProduct, a table that contains a detailed list of products with IDs.
Ideally, at this point you would link your list of bundles to the sales table and be done! However, the table of sales data contains detailed product names, not model names, and product IDs were left out at some point. Moreover, there is duplicate data in some tables, so that you cannot create a relationship between the sales data and the bundles. Therefore you need to add some new columns, and look up relationships.
A good way to work with complex data in PowerPivot is to sketch out a diagram of how all the data should be related, so that you can identify the data that is missing. In this case you look at the tables you have, and determine that you need to make the following adjustments to perform all the calculations for the analysis:
- Look up IDs. For better data mining results, the original view (in AdventureWorks) collapsed several categories of discontinued and related products. This created logical groupings of products and improved better forecasting. However, as a result, the names in the report generated by the data mining wizard do not always match the detailed names in the product list. Therefore you need to create some lookups, to get the product IDs based on model names.
- Normalize the data. PowerPivot does not support many-to-many relationships. Therefore, you can’t directly match the list of models to the models in the Products table. Instead, you need to set up your list of potential bundles, selected products, and recommended products in such a way that each table has no duplicate values. Then, when you have linked all the tables correctly, there will be a chain of relationships that links models to sales of individual products.
- Aggregate where needed. The names of some product models actually represent multiple products. For example, the helmet called the "Sport-100" encompasses several products with different products IDs, because each product ID represents a different size and color of helmet. In other cases, maybe the style or the features of the product model changed over the years, with each iteration fo the product getting a new Product ID, but in terms of brand loyalty and continuity you would want to analyze sales for all related products over time, and therefore would need to collapse multiple product IDs under one model. Unfortunately sales data is always at a more granular level, and can only be retrieved for individual product IDs. Therefore, to get an accurate picture of sales for the Sport-100 model, you need to create a summary that counts all sales of related products (=Sport-100 variants) as the same product.
Data mismatches of this sort are very common when you combine data from different sources. Even if data originally comes from the same source, data is often modified after exporting it from the database, or the data is summarized in such a way that you cannot easily retrieve details such as ID numbers. Fortunately, the tools in Excel and in PowerPivot make it easy to recombine the data without a lot of tedious copying and pasting.
For this scenario, to relate the bundles recommended by the data mining model to the detailed sales data, you will work with the data in Excel, and then convert those tables to Linked Tables.
Create Excel lists and tables
In Excel, copy the information from the data mining report into separate tables for recommended products and selected products, ensuring that each table has unique entries:
- Copy the list of Selected Products to a new Excel worksheet and remove duplicates. Convert to table. Add product IDs.
- Repeat for the list of Recommended Products.
Next, create the master list of all model names, both selected and recommended.
- Copy the list of Selected products to another worksheet.
- Append the list of Recommended products to that worksheet as well.
- Remove duplicates.
- Add an arbitrary set of temporary IDs to the model list by using the Fill Series option.
To get the product IDs, you can use various approaches, depending on the complexity of your data. For example, the product names did not match the product names in AdventureWorks, because some product names were truncated, and others were collapsed into a single category. If you need to work with a lot of data, you could use fuzzy lookup via Integration Services or even regular expressions. However, in this case, the list was quite short, so we used the DimProducts table as a source for IDs, and simply filtered that table using the PowerPivot filter options to show only the related products. We then copied the related product information into Excel, and used an Excel formula (similar to the following example) to look up the product ID based on model name:
=IF(MATCH([@ModelName],<lookup array>,0), LOOKUP(@ModelName),<lookup array>, <lookup result>),“not in list”)
Share Tables into PowerPivot as Linked Tables
Once you have created the tables that contains bundles, models, and products, and each table has IDs that can be used to connect them to other tables, you are ready to convert the lists to Excel tables.
But wait! At this point we highly recommend that you rename the tables, to give them a more descriptive name. By default, Excel names new tables as Table1, Table2, etc., and so forth, and PowerPivot will simply use those names when you create the Linked Tables. This can make it hard to manage relationships. (Don’t worry if you forget to rename your tables -- you can always delete the Linked Table, go back to Excel and rename the table with a descriptive name, and then re-add the Linked Table.)
Your PowerPivot data should now contain five tables: two from the AdventureWorks database, and three from the data mining reports.
| Imported from AdventureWorks | Tables based on data mining reports in Excel |
| FactInternetSales | RecommendedProductList |
| DimProduct | SelectedProductList |
| MasterProductList |
However, if you tried to build a PivotTable using this data, you would quickly realize that the way the tables are set up will give you an error or wrong results.
Fix Relationships in the Data
You used the table, DimProducts, to look up product IDs based on model name. However, when you add your model list and list of recommended and selected products to PowerPivot you discover an issue. Namely, PowerPivot does not allow multiple relationships between tables, because PowerPivot would not know which “path” to use when calculating the summary sales figures. Therefore, to ensure that there is one and only one relationship connecting each product to the detailed sales data, delete DimProduct. (You should have already obtained the IDs so you do not need DimProducts anymore.)
By the same token, you can’t connect both lists of products (selected and recommended) to a single table of sales details (FactInternetSales), because to do so would create multiple relationships that could be traversed when calculating aggregates. The PowerPivot restriction on having one and only one relationship between columns in any two tables also applies to indirect relationships.
You return to your diagram of how the data is related and quickly see the problem: FactInternetSales, which is the table with all the sales data, is being used by multiple “chains” of tables.
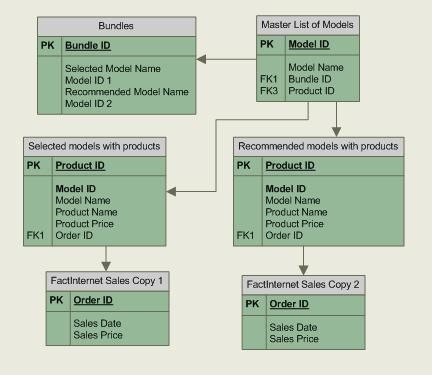
To prevent problems in your PowerPivot formulas, you add another copy of the FactInternetSales table. Then you can use one copy of the table to calculate sales for selected products, and the other copy of the table to calculate sales for recommended products.
Now you have all the data you need to create your reports. To convince your Web development team that it is worth implementing the recommendations from the data mining model, you will create a PowerPivot PivotTable that summarizes sales for each of the targeted products.
Create Calculations in PowerPivot
Once the data has been set up correctly, it is easy to create calculations that represent key decision factors such as the sales margin per bundle, and the sales for each model or product.
You might decide to create PivotTables that show the sales for selected and recommended products, but remember that these are essentially two separate sets of data: there is a list of Recommended products that is connected to one copy of the sales data, and there is a list of Selected products that is tied to another copy of the sales data. If you try to “mix”the two in one PivotTable, you will get odd results.
In this case, because this analysis is static – the bundles will never change– you can get all of the results in one table, by creating the sum of sales as a calculated column inside the product list.
- In the Linked Tables containing the lists of recommended and selected products, create a calculated column that calculates product margin for each row.
- Create a calculated column that sums the sales of each product, for example: =SUMX(RELATEDTABLE(copyFactInternetSales),copyFactInternetSales[SalesAmount])
The following screenshot shows the summary of sales for each model in the selected and recommended product lists.
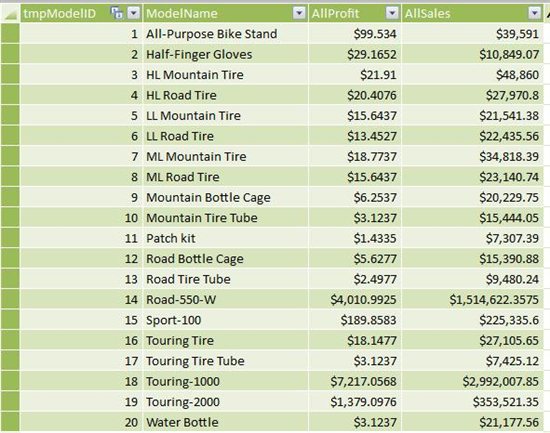
Once you have these results, you might decide to push bundles that have a higher combined profit margin, or you might decide to prioritize bundles based on past sales of the linked products. By putting all this information together in one workbook, you have leveraged the value of data mining, and provided your sales team with the data needed to support the proposed product linkages.
Resources
This section provides links to additional resources.
Information about system requirements, architecture, and performance
- http://blogs.msdn.com/powerpivot/default.aspx
- http://powerpivotgeek.com/2010/03/25/64-bit-verses-32-bit-whats-right-for-you/
Tips on maximizing compression, and determining which columns are using the most memory
Kasper DeJonge: Using data mining results in a tabular model
How much training data is enough?
PowerPivot deployment whitepaper
Mark Tabladillo presentation of integrating PowerPivot with data mining
PowerPivot team blog
Troubleshooting installation problems
The troubleshooting information formerly included here as an Appendix has been moved to a separate topic.
http://social.technet.microsoft.com/wiki/contents/articles/13737.troubleshooting-installations-of-powerpivot-and-other-add-ins.aspx
The following site also contains a list of known issues, including installation.
See Also