OpsMgr: Displaying Agent Average Send Queue Size with a Blue Bar State Widget
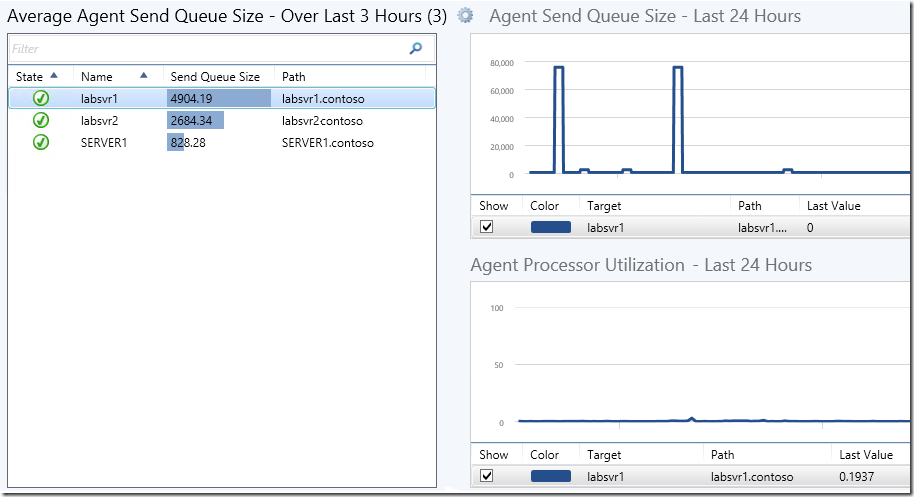
This post demonstrates how the Blue Bar State Widget Template (Download Here) can be used to create a custom dashboard in the OpsMgr 2012 Operations Console, to display the health state, patch level and average Send Queue Size of each managed agent, and to allow the user to visually identify maximum and minimum values of their Send Queue Sizes on the column with the blue bar.

A high average Send Queue Size value for an agent over a long period of time, e.g over 3 hours, could indicate that the agent is collecting a lot of monitoring data from a monitored server like event or performance data. This could be due to misconfigured collection workflows where they could be running too frequently, may not be targeting the right class or may have loose (collect all) filters in their filtering expression or even problematic application issues like the case outlined in the previous post.
These configuration issues must be addressed to avoid flooding of data in the OpsMgr databases, and unnecessary consumption of resources in the monitored servers and database servers.
For an example of how the influx of collected events affected the Send Queue Size of an agent and the data set in a data warehouse database over time, please refer to the following blog post entitled:
An Inflating Event Data Set !? The Case of the Rogue Event Collection Workflow.
To create an instance of the dashboard shown above using the Blue Bar State Widget Template, first, create a dashboard layout with 1 cell, Click to add widget on a cell, then select the Sample Blue Bar State Widget template located under the "All Templates/WeiOutThere Blue Bar Column Template" folder , go through the UI pages of the template and enter the required information.

Here is a sample PowerShell script that can be inserted into the “PowerShell Script” page of the widget template to create a Blue Bar State Widget that consist of a list of managed objects representing all Microsoft Monitoring Agents in the current management group (all instances of the Microsoft.SystemCenter.Agent class). The health state, patch level and average Send Queue Size over the last 3 hours (Blue Bar column) for each agent is displayed in their respective columns as well.
 $class = get-scomclass -Name Microsoft.SystemCenter.Agent
$Agents = Get-SCOMClassInstance -class $class

$avg_stat = @{}
$dataObjects = @()
#///////// Functions Section ///////////////////// START
function RecalculateMinMaxForAvgStatItem
{
param($name, $value)
$avg_stat[$name]["min"] = ($avg_stat[$name]["min"], $value | Measure -Min).Minimum
$avg_stat[$name]["max"] = ($avg_stat[$name]["max"], $value | Measure -Max).Maximum
}

function CreateStatistics {
param($value)

$stat = $ScriptContext.CreateInstance("xsd://Microsoft.SystemCenter.Visualization.Library!Microsoft.SystemCenter.Visualization.DataProvider/PerformanceDataStatistics")
if ($value -ne $null) {
$stat["AverageValue"] = [double]$value
$stat["Value"] = [double]$value
}
$stat
}

# Initialize Stat Item:
function InitAvgStatItem {
param($name)

if ($avg_stat[$name] -eq $null) {
$avg_stat[$name] = @{}
$avg_stat[$name]["min"] = 0
$avg_stat[$name]["max"] = [Int32]::MinValue
}
}

function AddColumnValue {
param($dataObject, $name, $value)

$v = $value

InitAvgStatItem $name
if ($v -ne $null) {
$dataObject[$name] = CreateStatistics($v)
RecalculateMinMaxForAvgStatItem $name $v
}
else
{
$dataObject[$name] = $null
}
}
#///////// Functions Section ///////////////////// END

#///////// Main Section ///////////////////// START

foreach ($Agent in $Agents) {
$dataObject = $ScriptContext.CreateFromObject($Agent, "Id=Id,State=HealthState,Name=Name", $null)

$dataObject["Name"]=$Agent.Path
$dataObject["Patch Level"]=$Agent.'[Microsoft.SystemCenter.HealthService].PatchList'.value
$dataObject["Path"]=$Agent.Path

if ($dataObject -ne $null)  {

#Last 3 hours UTC
$aggregationInterval = 3
$dt = New-TimeSpan -hour $aggregationInterval
$nowlocal = Get-Date

#Convert local time to UTC time
$now = $nowlocal.ToUniversalTime()
$from = $now.Subtract($dt)

$perfRules = $Agent.GetMonitoringPerformanceData()
foreach ($perfRule in $perfRules)     {

if($perfRule.CounterName -eq "Send Queue Size" -and $perfRule.RuleDisplayName -eq "Collect Health Service Management Group\Send Queue Size")   {
$data = $perfRule.GetValues($from, $now) | % { $_.SampleValue } | Measure-Object -Average
AddColumnValue $dataObject $perfRule.CounterName $data.Average
}

}
$dataObjects += $dataObject
}
}

foreach ($dataObject in $dataObjects)
{
foreach ($metric in $avg_stat.Keys)
{
$stat = $avg_stat[$metric]
$dataObject[$metric]["MinimumValue"] = [double]$stat["min"]

if ($stat["max"] -ne [Int32]::MinValue)
{
$dataObject[$metric]["MaximumValue"] = [double]$stat["max"]
}
else
{
$dataObject[$metric]["MaximumValue"] = [double]0
}
}
$ScriptContext.ReturnCollection.Add($dataObject)
}
On the “Refresh Interval” page, enter a numerical value for the refresh interval of the widget (in seconds), then click the Finish button to create the custom Blue Bar State Widget.
Here is another example of a dashboard that consist of a Blue Bar State Widget with the managed agents created using the sample PowerShell script above and two other Contextual Performance Widgets created with the Sample Contextual Performance Widget Template.

The performance counter specified for the first Contextual Performance Widget for Agent Send Queue Size is:
Performance Object: Health Service Management Groups
Performance Counter: Send Queue Size
Performance Instance: %
The performance counter specified for the second Contextual Performance Widget for Agent Processor Utilization is:
Performance Object: Health Service
Performance Counter: agent processor utilization
Disclaimer:
All information on this blog is provided on an as-is basis with no warranties and for informational purposes only. Use at your own risk. The opinions and views expressed in this blog are those of the author and do not necessarily state or reflect those of my employer.