OpsMgr: An Inflating Event Data Set !? The Case of the Rogue Event Collection Workflow.
This post uses a case study to demonstrate how the Data Volume by Management Pack Report (DVMP Report) was utilized to identify the root cause of an inflating event data set that was occurring in a data warehouse database (DW DB) of an OpsMgr management group.
While reviewing the overall size and space usage of a data warehouse database in an OpsMgr 2012 R2 Production environment, my business counterpart, Michael Giancristofaro, and I noticed that the event raw data set was taking up the largest percentage of that data warehouse’s data sets, at 52% as shown in the following pie chart and table. The actual size of the event data set was more than 30 GB at the default 100 days of retention.
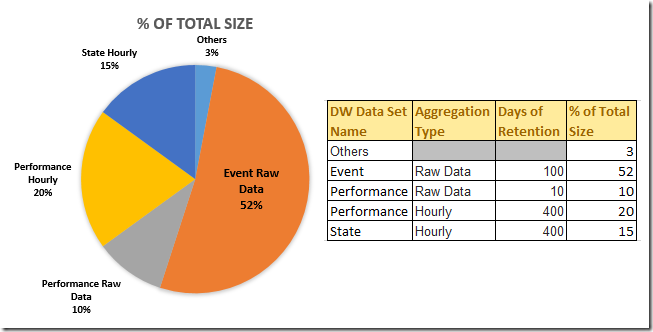
This is not a normal result as the size of the event raw data set with 100 days of retention should usually be a lot smaller compared to most data sets in the data warehouse database, especially the size of the performance and state hourly data sets with the default 400 days of retention. This is an indication that usually means that this OpsMgr management group has been customized with custom collection workflows to collect data of event data type from Windows eventlogs or other data sources for reporting or audit purposes. Sometimes these custom event collection workflows may not be targeting the right class or configured correctly with the right filters. They could be constantly collecting a lot of event data that could inflate the overall size of the event raw data set in the data warehouse database and consume resources and free space on the host database server.
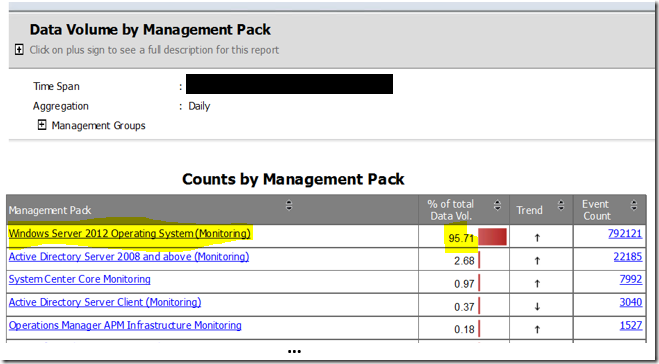
To investigate further, we ran the Data Volume by Management Pack Report under the System Center Core Monitoring Reports folder, scoped to a time span of 1 week and to the Event data type only and got the following result. It turned out that it was not a custom management pack that had the highest data volume but instead it was the Windows Server 2012 Operating System (Monitoring) management pack with the highest event counts and made up more than 95% of the total data volume of all management packs in this OpsMgr 2012 R2 management group.
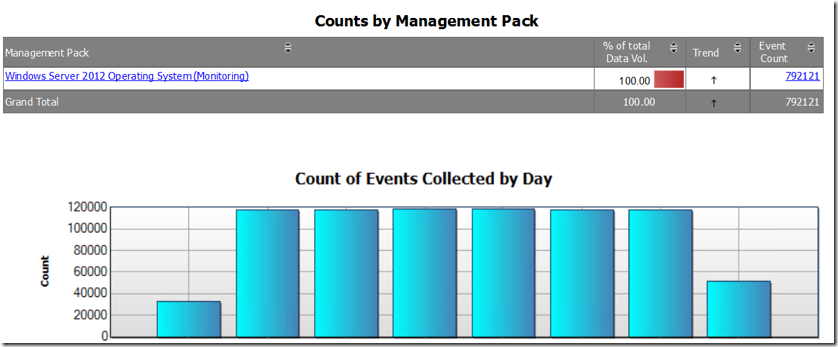
This DVMP Report allows us to drill down to find out the Count of Events Collected per Day by the event collection workflows defined in the Windows Server 2012 Operating System (Monitoring) management pack.
From there, we were able to drill down even further with the DVMP Report to identify the servers and collection rules with the highest data volume.
As indicated in both of the tables below, in this instance, the workflow with the highest data volume and event count was the Collection rule for unexpected service terminations. It’s total count of events collected matches that of an OS Object (of display name: Microsoft Windows Server 2012 R2 Standard), which is an instance of the Windows Operating System Class hosted on Server X.

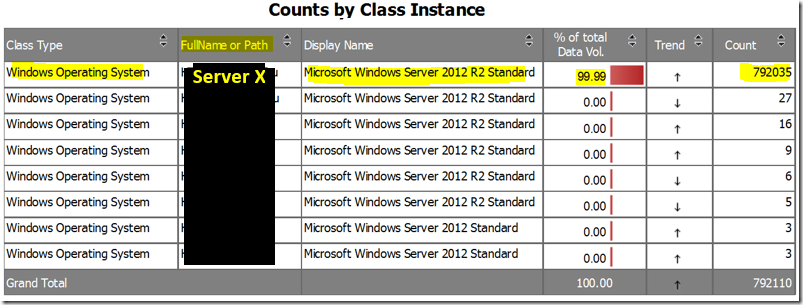
With the information about the host server and workflow name obtained from the DVMP Report, we were about to find out more about the MMA agent performance on Server X and the configuration of the event collection rule:
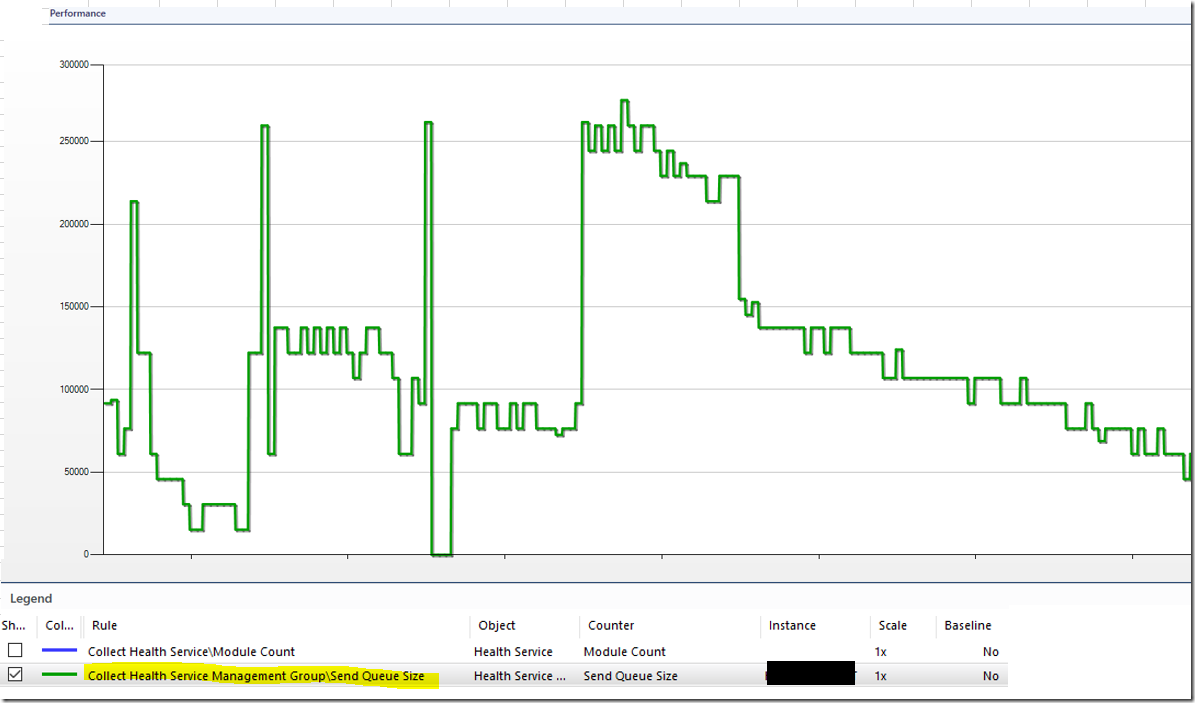
1. The MMA agent on Server X was constantly recording very high Send Queue Size numbers as shown on the Performance view below over a snapshot of the last 7 days:
2. The Collection rule for unexpected service terminations workflow is configured to collect all events with EventId 7031 generated in the System Eventlog.

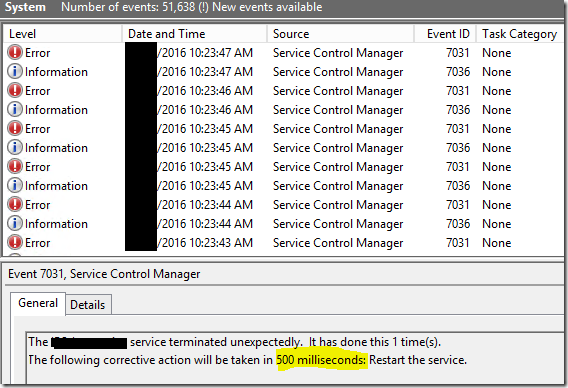
Finally, when we checked the System Eventlog on Server X, we were able to find the root cause of the inflating event data set in the data warehouse database:
Service Control Manager Error events with Event Id 7031 were being logged EVERY SECOND in the System eventlog on Server X! This was due to a decommissioned Windows service terminating unexpectedly every time it was automatically restarted 500 ms after every termination. All these Error events were being collected by the MMA Agent on Server X with the Collection rule for unexpected service terminations and pumped into the Operational and data warehouse databases via the primary management server.
With this discovery, we applied to following tuning actions:
- Apply an override to disable the Collection rule for unexpected service terminations on Server X to stop the flooding of event data first.
- Fix, uninstall or disable the decommissioned Windows service that was causing noise in the System eventlog.
- Uninstall the MMA Agent from Server X if Server X is no longer in Production
- Since more than 99 % of the event raw data set in the data warehouse database was made up of data from the noisy events occurring in Server X as mentioned above, we decided to change the retention period of the event raw data set to 10 days for 24 hour to remove the noise and get back some free space on the data warehouse database.
- the retention period of the event data set was reset back to 100 days on the next day after the grooming tasks was run on the data warehouse database.
To create a custom dashboard in the OpsMgr 2012 Operations Console to display the health state, patch level and average Send Queue Size of each managed agent, and to allow the user to visually identify maximum and minimum values of their Send Queue Sizes on the column with the blue bar, refer to the following post:

OpsMgr: Displaying Agent Average Send Queue Size with a Blue Bar State Widget
https://blogs.msdn.microsoft.com/wei_out_there_with_system_center/2016/09/25/opsmgr-displaying-agent-average-send-queue-size-with-a-blue-bar-state-widget/
Disclaimer:
All information on this blog is provided on an as-is basis with no warranties and for informational purposes only. Use at your own risk. The opinions and views expressed in this blog are those of the author and do not necessarily state or reflect those of my employer.
Comments
- Anonymous
November 06, 2017
I just wanted to thank you for this blog post.My datawarehouse filled up over the weekend and I narrowed it down using the information you provided here. Mine was related to SSH but still it was logging ~45 events per second, every second. My Send Queue Size for that specific server was approaching 500,000. I had to restrict my query to the past 12hrs because the report timed out at the -7 days in your example. There were 2.23 million events even at that. The issue is being fixed now and once that's done, I'm going to set my grooming to 24hrs like you suggested and claw back some of that space I lost to event data.