Using the Concurrency Visualizer to Analyze MPI Communication Overheads
The Message Passing Interface (MPI) is a popular API for developing message-passing based parallel applications on clusters. Microsoft has a Windows HPC Server product that includes an implementation of MPI, among other things (visit https://www.microsoft.com/hpc). In this post, I’d like to demonstrate how the Visual Studio Concurrency Visualizer can be used to efficiently identify MPI communication overheads on the Windows HPC Server platform. Before I start, I’d like to acknowledge the help of some colleagues of mine, Jeff Baxter, Mayank Agarwal, Matthew Jacobs, and Paulo Janotti, who helped me prepare the material for this post.
One of the difficulties in analyzing MPI overheads using the Concurrency Visualizer is that the runtime system may use polling to reduce communication latency on some network platforms that support it. This hides what are logically blocking operations from the tool, making it difficult for the Threads view to illustrate exactly how often threads block waiting for messages, barriers, or reduction operations and where those events take place in the application code. Instead of showing these as blocking events, they will appear to be green execution segments in the tool. Although the Execution profile report will usually show these costs, they can be difficult to pinpoint as they may account for a small fraction of total samples. Even on network implementations where polling is not used (e.g., pure Gigabit Ethernet), blocking on MPI network communication might appear as blocking on synchronization or some other category.
In order to make MPI communication analysis easier on developers, we’ve included special support in the Concurrency Visualizer to show MPI delays in the I/O category. Here are the steps necessary to accomplish this:
1. Install the command-line profiling tools on one of your cluster compute nodes. This requires running the installer from the \Standalone Profiler\x64\vs_profiler.exe on your Visual Studio Premium or Ultimate DVD (or the ISO image for Beta 2). You also need to install .NET 4.
2. In order to enable the Concurrency Visualizer MPI functionality, you need to disable polling in the MPI runtime. This can be accomplished by supplying a special environment setting when launching your MPI application, as shown in the following command:
job submit /numcores:8 mpiexec –env MPICH_PROGRESS_SPIN_LIMIT 1 …executable_path..
Note that setting the MPICH_PROGRESS_SPIN_LIMIT environment variable is the special sauce that you’ll need to address the spinning vs. blocking issue described above.
3. When you’re ready to profile your application, follow the instructions for the attach scenario using the command-line tools described in my blog here.
4. Copy the resulting .vsp and .ctl files to the machine that has Visual Studio 2010 Premium or Ultimate installed and open the .vsp file. Make sure that you have an appropriate symbol path that includes symbols for msmpi.dll (the Microsoft public symbol server should be sufficient).
To illustrate how an MPI profile looks like in the Concurrency Visualizer, let’s take a look at a simple Jacobi implementation with nearest neighbor communication at partition boundaries:
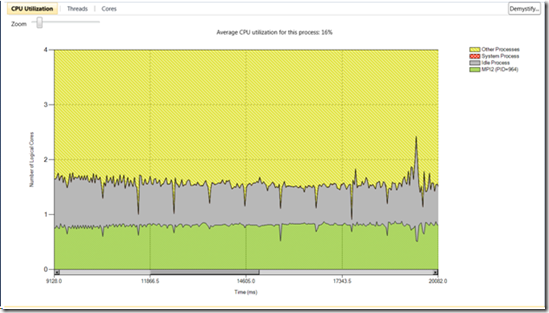
In the above CPU Utilization view, you’ll notice that the MPI process, which is supposed to consume 100% of a single core on average is only consuming about ~70-80% of a core. That’s usually an indication of either synchronization or I/O. In this case, since the MPI application is single threaded, I/O must be the culprit. Now here’s what the Threads view shows when we examine this run:
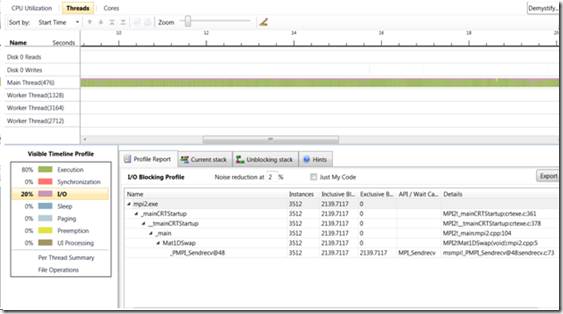
We now see some purple (I/O delays) mixed in with the green on the timeline that correspond to delays waiting on MPI messages. The legend also shows that 20% of the time is spent blocking on I/O, which makes sense based on what we saw in the CPU Utilization view. You can also see in the I/O report that all blocking MPI calls are clearly shown and the call stacks are collated and ordered to show you the most significant sources of delay (in this simple example, there’s only a single stack with an MPI_Sendrecv). As usual, you can jump straight from the reports to the source code in order to tune your application. If it wasn’t for the custom MPI experience in the Concurrency Visualizer, you might have observed various categories of blocking delays depending on the underlying kernel mechanisms used, instead of the MPI calls that are more intuitive from a programmer’s perspective.
You should be aware that changing from polling to blocking introduces some latency, so there’s a perturbation in execution, but when your application suffers from significant messaging overheads, it is sometimes an acceptable cost in return for better diagnostic feedback.
I hope that you’ll find this useful. Now go have some fun!
Hazim Shafi – Parallel Computing Platform

