App-V 5.0 – ETW Tracing Automation
Hi all,
I’ve been meaning to write this for a long time now and finally I’ve had some time to actually sit down and write it.
The question that I always get asked onsite with customers is “how do we troubleshoot App-V 5.0?”
Some of the common errors we see look like this:
Application Failed to launch
Sync Failure
The starting point is the App-V event log which sits under Applications and Services Log – Microsoft – AppV – Client. The main log that you will use is the Admin Log.
Next step is to look at the “hidden” and “magic” debug logs which are available by selecting:
View – “Show Analytic and Debug Logs”
If you have ever looked at the extra logs there are certainly a lot available but which ones should you enable? Steve Thomas has given some great guidance into which logs you should enable in certain situations.
If anyone that has ever used these logs you have to enable them individually and manually which is a time consuming experience.
So let’s automate it, but where do you start?
Well Logman is your friend for ETW automation.
https://technet.microsoft.com/en-us/library/cc753820.aspx
Logman creates and manages Event Trace Session and Performance logs and supports many functions of Performance Monitor from the command line.
e.g. logman [create | query | start | stop | delete| update | import | export | /?] [options]
You can create a logman trace using the following script:
# Script Variables$trace = "APPV5Debug"$ETL_trace_output = "$env:temp\appv5Debug.etl"$Random = Get-Random$ProviderFile = "$env:temp\AppVClientProviders$Random.txt" # Collecting all the App-V Providers on the machine$Providers = Get-WinEvent -ListProvider Microsoft-AppV* $AppVProviders = $Providers.Name | sort # For each provider adding them to the Provider File so that Logman can import itforeach($entry in $AppVProviders){ ac $ProviderFile $entry } # Creating Logman Tracelogman.exe create trace $trace -o "$ETL_trace_output" -f bincirc -max 512 -pf "$ProviderFile" -ct perf -ow –v |
If we break the main part of this script we need to get all the provider for App-V registered on the machine so we’re using Get-WinEvent to find all the App-V providers.
$ProviderFile = "$env:temp\AppVClientProviders$Random.txt" # Collecting all the App-V Providers on the machine$Providers = Get-WinEvent -ListProvider Microsoft-AppV* $AppVProviders = $Providers.Name | sort |
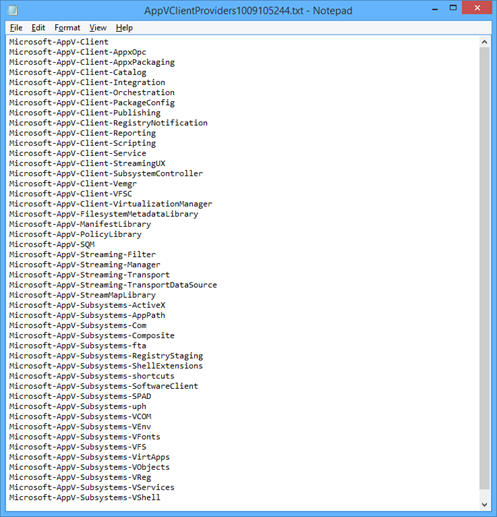
Once we have this then the AppVClientProviders.txt file is created which will look something like this.
The final section is running the logman command.
# Creating Logman Tracelogman.exe create trace $trace -o "$ETL_trace_output" -f bincirc -max 512 -pf "$ProviderFile" -ct perf -ow –v |
The command switches are explained below:
-o Path of the output log file
-f Specifies the log format for the data collector
-pf File listing multiple Event Trace providers to enable
-ct <perf|system|cycle> Specifies the clock resolution to use when logging the time stamp for each event.
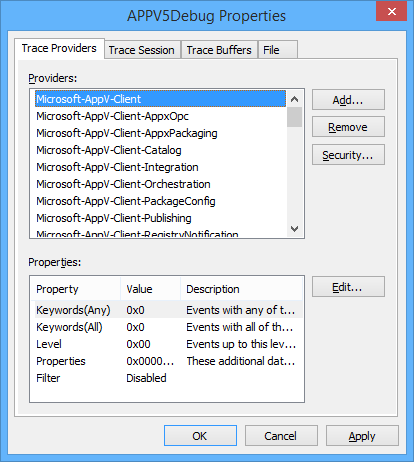
Once this has been ran the following “Data Collector Sets” under User Defined will be created in Performance Monitor.
You can view the properties of this data by right clicking and selecting “Properties”.
Once the settings you have configured are correct then you can start the trace with either the GUI:
Or through the logman command line:
Logman start APPV5Debug
Once the problem has been reproduced then stop the trace:
Logman stop APPV5Debug
Once the trace has been stopped the “appv5Debug.etl” will be available to be manipulated.
So that’s great we have an ETL trace of the problem but how do we view the trace??????
How many people have heard or have used Tracerpt.exe???
https://technet.microsoft.com/en-us/library/cc732700.aspx
The tracerpt command can be used to parse Event Trace Logs, log files generated by Performance Monitor, and real-time Event Trace providers. It generates dump files, report files, and report schemas.
Tracerpt.exe Usage
-l Event Trace log file to process
-lr Less restrictive; use best effort for events not matching event schema
-of <CSV|EVTX|XML> Dump format, the default is XML
-o [filename] Text output file. Default is dumpfile.xml.
# Variables$ETL_trace_output = “$env:temp\appv5Debug.etl“$Date = get-date -f "ddMMhhmm"$EVTX_trace_output = "$env:temp\appv5Debug$Date.evtx" # Tracerpt command usedtracerpt.exe -l $ETL_trace_output -lr -of EVTX -o $EVTX_trace_output |
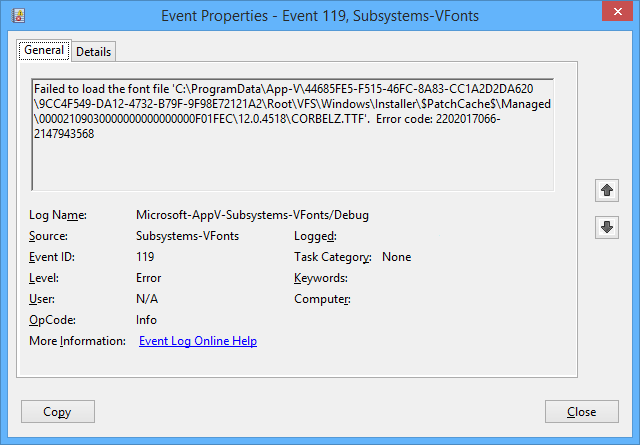
Once tracerpt.exe has been ran you can then open the EVTX with the “Event Viewer” for extra debug information.
e.g.
Below is the full script that I use, it offers prompts to start and stop traces and some error checking.
# Script Variables$trace = "APPV5Debug"$Date = get-date -f "ddMMhhmm"$ETL_trace_output = "c:\temp\appv5Debug.etl"$EVTX_trace_output = "c:\temp\appv5Debug$Date.evtx"$Random = Get-Random$ProviderFile = "$env:temp\AppVClientProviders$Random.txt" # Collecting all the App-V Providers on the machine$Providers = Get-WinEvent -ListProvider Microsoft-AppV* $AppVProviders = $Providers.Name | sort # For each provider adding them to the Provider File so that Logman can import itforeach($entry in $AppVProviders){ ac $ProviderFile $entry } write-host $query_logman = logman query APPV5DEBUG if($LASTEXITCODE -eq "-2144337918"){write-host "Data Collector Set was not found"write-hostwrite-host "Creating Logman Trace..."logman.exe create trace $trace -o "$ETL_trace_output" -f bincirc -max 512 -pf "$ProviderFile" -ct perf -ow --vwrite-host} elseif($LASTEXITCODE -eq "0"){write-host "Data Collector Set already exists..."write-host "Deleting to ensure all the App-V Collectors are available..."write-hostlogman.exe delete $tracewrite-host "Creating Logman Trace..."logman.exe create trace $trace -o "$ETL_trace_output" -f bincirc -max 512 -pf "$ProviderFile" -ct perf -ow --vwrite-host} $Start_Trace = read-host -prompt "Do you want start the trace now? (Y/N)" if ($Start_Trace -eq "Y" -or $Start_Trace -eq "y"){write-host "Starting Logman Trace $Trace" -f yellowlogman.exe start $tracewrite-host} elseif ($Start_Trace -eq "N" -or $Start_Trace -eq "n"){write-host "You will need to start the trace manually from perfmon.exe..." -f yellowexit} $Stop_Trace = read-host -prompt "Do you want stop the trace now? (Y/N)" if ($Stop_Trace -eq "Y" -or $Stop -eq "y"){write-host "Stopping Logman Trace $Trace" -f yellowlogman.exe stop $tracewrite-hostwrite-host "Converting Trace to EVTX format..."tracerpt.exe -l $ETL_trace_output -lr -of EVTX -o $EVTX_trace_outputwrite-hostwrite-host "Opening EVTX trace - $EVTX_Trace_output..."Invoke-Item $EVTX_Trace_output } elseif ($Stop_Trace -eq "N" -or $Stop_Trace -eq "n"){write-host "You will need to stop the trace manually from perfmon.exe..." -f yellow} |
To run this make sure you run the script as administrator otherwise when the script try to remove the previously created trace with fail with the following error.
Error:
Access is denied.
You're running with a restricted token, try running elevated.
Disclaimer
The sample scripts are not supported under any Microsoft standard support program or service. The sample scripts are provided AS IS without warranty of any kind. Microsoft further disclaims all implied warranties including, without limitation, any implied warranties of merchantability or of fitness for a particular purpose. The entire risk arising out of the use or performance of the sample scripts and documentation remains with you. In no event shall Microsoft, its authors, or anyone else involved in the creation, production, or delivery of the scripts be liable for any damages whatsoever (including, without limitation, damages for loss of business profits, business interruption, loss of business information, or other pecuniary loss) arising out of the use of or inability to use the sample scripts or documentation, even if Microsoft has been advised of the possibility of such damages.
Conclusion
I hope this helps with your collection of debug traces and with your troubleshooting of App-V 5.0.
David Falkus | Premier Field Engineer | Application Virtualization
Comments
- Anonymous
May 12, 2014
Have you ever been testing a virtualized application and it fails with a bizarre application error that - Anonymous
May 29, 2014
Have you ever been testing a virtualized application and it fails with a bizarre application error that - Anonymous
September 19, 2014
Awesome! Thank you. - Anonymous
April 07, 2015
Thank Q BUDDY


