Azure Log Analytics: Disk Space Usage – Part 2
My previous post on this topic is one of the most viewed (according to our blog analytics in the last week). So I thought it was time to share some extra queries that you many find helpful.
Please see the previous post,
Part 1: https://blogs.msdn.microsoft.com/ukhybridcloud/2017/12/08/azure-log-analytics-disk-space-usage/
The original query I produced was this:
// original capacity query
Perf
| where ObjectName == "LogicalDisk" and CounterName == "% Free Space"
| summarize FreeSpace = min(CounterValue) by Computer, InstanceName
| where strlen(InstanceName) ==2 and InstanceName contains ":"
| where FreeSpace < 50
| sort by FreeSpace asc
| render barchart kind=unstacked
I have now refined it, it’s now a stacked chart (so more than one driver letter is shown per computer) I’ve also added a Let statement to set the % value (my new line #1). This now shows in my example 9 servers that have drives below 60% usage (and one server that has two drives below that value). These servers have a lot of spare space (currently), so you will probably be changing that value to something much smaller?
// New capacity query
let setpctvalue = 60; // enter a % value to check
Perf
| where TimeGenerated > ago(1d)
| where ObjectName == "LogicalDisk" and CounterName == "% Free Space"
| where InstanceName contains ":"
| summarize FreeSpace = min(CounterValue) by Computer, InstanceName
| where FreeSpace < setpctvalue
| render barchart kind = stacked 
If you want you can also restrict this query and add a sort to it by adding these lines just before the final one. I just wanted the Top 5 disks listed – this is useful if you have many servers and drives below your required threshold.
| top 5 by min_CounterValue
| sort by min_CounterValue desc nulls last 
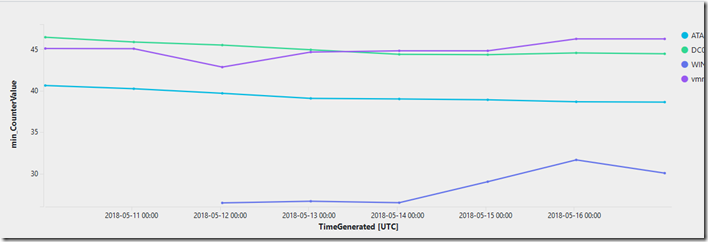
To add to this capability I wanted to track down some C: drive issues, and also wanted to look over more than a 1 day period. In this example I selected 7 days, once again to aid readability I added a Let statement for this.
I also added bin (TimeGenerated) to see the extra days of data, and this also allows a TimeChart to be used. An extra modification was changing line #7 to look at only C: - other drive letters are available.
// Chart C: if its under nn% over the past nn days
let setpctValue = 50; // enter a % value to check
let startDate = ago(7d); // enter how many days to look back on
Perf
| where TimeGenerated > startDate
| where ObjectName == "LogicalDisk" and CounterName == "% Free Space"
| where InstanceName contains "C:"
| summarize min(CounterValue) by Computer, InstanceName, bin (TimeGenerated, 1d)
| where min_CounterValue < setpctValue
| sort by min_CounterValue desc nulls last
| render timechart
This showed 4 servers and the data for the past 7days – and I now have this published to my Azure Dashboard.
That’s all for today, there will be a Part 3 where I’ll look at a Trend line and a capacity estimate to see when the drive space will be zero.
Comments
- Anonymous
September 06, 2018
Part 3! https://blogs.msdn.microsoft.com/ukhybridcloud/2018/05/18/azure-log-analytics-disk-space-usage-part-3/- Anonymous
September 07, 2018
Thanks Mike, post is now updated
- Anonymous
