DfE and Microsoft bring Open Data to life with Power BI
Microsoft and the Department for Education (DfE) have recently collaborated to showcase how open data published by the UK government can be modelled and visualised with Power BI to bring their data to life and make it more engaging.
School Workforce Census
Since 2010, the DfE has published their annual School Workforce Census data. This includes statistics on the number and characteristics of teachers, teaching assistants and other non-classroom-based school support staff in all schools in England. The data is published as part of their Open Data Strategy and includes a copy of the raw data as spreadsheets in ODS or Microsoft Excel format. This is accompanied with a static PDF report, prepared by the DfE's statisticians, that summarises and describes the key findings.
To understand why we undertook this project and the benefits we wanted to achieve, let's briefly consider the current state of Open Government Data in the UK.
What is Open Government Data?
The UK government is a strong advocate and practitioner of making public sector information available to the public as open data. This means that it is: accessible to all at no more than the cost of reproduction; available in a digital, machine readable format; and free of restriction on its use or redistribution (under the Open Government Licence terms).
A key driver for publishing this data is transparency. This includes making data available to allow members of the public to make informed choices about public services, holding central and local government accountable for spending and outcomes, and enabling the private sector to develop innovative new services.
In their 2012 Open Data Whitepaper, The government "committed to making open data an effective engine of economic growth, social wellbeing, political accountability and public service improvement". To date, they have published over 40,000 datasets on the Data.Gov.UK site, adopted the principles of the Open Data Charter, and the UK is now ranked first in the world by The Open Data Barometer for readiness, implementation and impact, and 2nd in the Global Open Data Index.
Who uses Open Government Data?
The government provides statistics on the number of views and downloads for published datasets and views for the publishers of that data. This provides us with some insights, but it cannot tell us anything about the profiles of the persons or organisations accessing the data or what they did with it.
The government's open data principles focus on the quality, consistency, availability and open access of data. Open data should be in a re-usable format, which means it is structured and stored in a machine-readable form based on open standards. This is typically one or more CSV files depending on the volume of the data, which restricts its usage to those with the tools and skills to analyse the data. Alternatively, it is made available through Applications Programming Interfaces (APIs). It is reasonable to assume, therefore, that the primary users are predominately government departments themselves, researchers, journalists, commercial organisations, or software developers.
Most individuals and organisations are dependent on the private sector to develop services and applications on top of open data to make it easy to use and relevant for their needs. There is a growing industry of organisations and start-ups building these solutions and the government will actively promote apps that utilise open data on its open data portal. Transport for London is a great example of the impact that open data can have, while also recognising that this success has been built on a determined effort over 10 years.
What were the objectives of this project?
In the words of Isi Avbulimen, Statistical Officer at the DfE, who worked on the project…
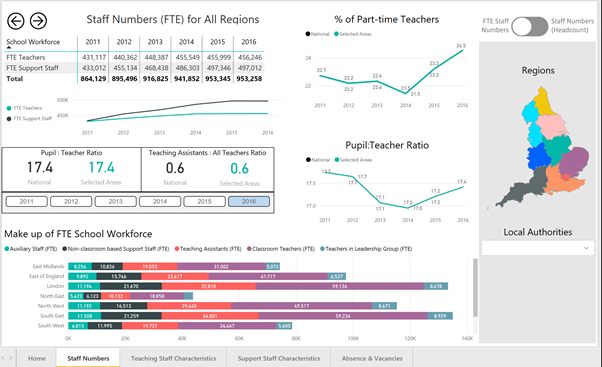
"The School Workforce Power BI dashboard is a joint project between Teachers Analysis Division at the Department for Education and Microsoft. It is an interactive dashboard that will allow users to visualise National, Regional and LA Level data in a colourful, interactive, and graphic form utilising a user-friendly format.
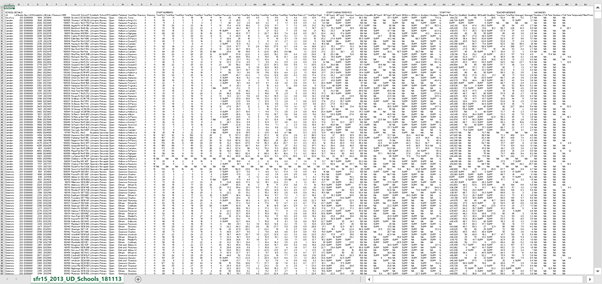
The dashboard is based entirely on published data from the School Workforce Census (SWC). The data is currently published within a large, complex non-machine readable Excel file comprising of over 20,000 rows, making the data largely inaccessible to the general public who do not have expertise in data manipulation. This dashboard will allow users to pull out the information they are interested in and perform their own analysis.
The dashboard will allow users to examine time series data for a range of different measures at the click of a button, e.g. users can easily examine how the headcount of teachers within the schools of York has varied over time."
How did we prepare the data for analysis?
We performed several steps in Power BI to get the data into the correct shape before we created the visualisations. These included loading and consolidating multiple year files into single tables, joining it with additional school data from 'Get Information About Schools', conforming the data to ensure consistency, converting the flat files back into a data model with dimension and fact tables, and adding some calculated measures and shape map files.

Screenshot of one of the source files downloaded from Data.Gov.UK
We also scaled back the scope of the project. A decision was taken to exclude all data for 2010 because there were too many structural differences with other years. We also removed the school level data because it is subject to data suppression to prevent the identification of individuals. This meant that school level aggregations could be slightly different from local authority level aggregations and might lead to confusion. An extension of the project could be to republish this data separately.

Screenshot of one of the Power BI report pages
What lessons did we learn?
The opportunity to analyse trends and changes over time are key insights that would not have been possible without going through the process of consolidating multiple files.
Combining data from multiple sources (e.g. Get Information About Schools) would not have been practical without transforming the data into a related data model. Conversely, building data models provides the opportunity to combine data sources from multiple public sector bodies, a key objective of the Government Transformation Strategy.
The latest UK assessment by the European Data Portal identified issues with users' awareness of open data and understanding the value of these datasets. This project took a single dataset and reimagined how it could have been presented (alongside the open data) to lower the barriers to its use.
There are real opportunities to make open data easier to find, access and use. These include: predesigned reports that allow people to get started immediately and interactively query the data; agile tools that empower analysts to explore the data and build their own reports; and natural language interfaces and AI-powered agents that will query the data on your behalf.
The latest generation of self-service visualisation and analytics tools, such as Power BI, will provide all these capabilities. For many requirements this will be a more cost-effective and viable option than directly analysing the open data files or developing an application to do it.
Finally…
Click here to see the report. Try selecting a region from the map or searching for your local authority.