Note
Access to this page requires authorization. You can try signing in or changing directories.
Access to this page requires authorization. You can try changing directories.
This is a blog post in the series “How to display Recommendations and Popular items on a website”. In the previous post, I showed you how to display recommendations on a website with anonymous users. In this blog post:
- About the usage analytics reports
- View the Most Popular Items report for a catalog
- Change the Recent time period for a usage event
- Narrow the Most Popular Items report to a specific attribute or category
- View the Popularity Trends report for an item
- About the TailTrimming parameter
About the usage analytics reports
The usage analytics reports show statistics of how visitors have interacted with the content on your website, for example which item has been viewed the most. The reports are broken down per usage event. This means that by default you’ll be able to see:
- The number of views for an item.
- The number of recommendations displayed per item.
- The number of recommendations clicked per item.
SharePoint Server 2013 creates two usage analytics reports:
- Most Popular Items – shows usage event statistics for all items in a library or list.
- Popularity Trends – shows usage event statistics for an item, a site or a site collection.
The reports are automatically updated once every 24 hour when the usage analytics job is run.
View the Most Popular Items report for a catalog
In a cross-site publishing scenario where you are displaying catalog content on a Publishing site, you view the Most Popular Items report on your authoring site. Do the following:
1. On your Authoring site, go to your catalog.
2. Click the LIST tab –> Most Popular Items.

3. On the Most Popular Items page, use the menu to select which usage event you want to view statistics for.

Note: You can view statistics for the Recommendations Displays usage event in the Popularity Trends report.
Change the Recent time period for a usage event
On the Most Popular Items page, there are two time periods: Recent and Ever.
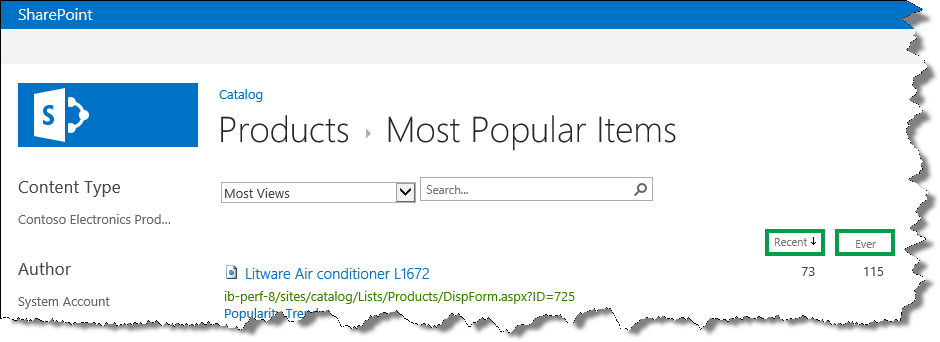
The Ever time period shows statistics from the first day a usage event was recorded. The Recent time period is by default set to the last 14 days. To view the default settings of a usage event, do the following:
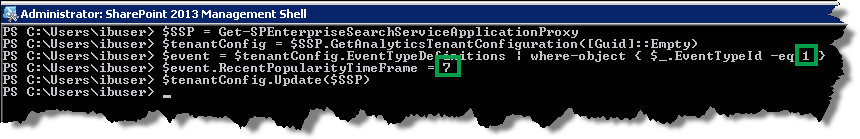
1. On the server where SharePoint Server 2013 is installed, open the SharePoint 2013 Management Shell.

2. At the Windows PowerShell command prompt, type the following commands:
$SSP = Get-SPEnterpriseSearchServiceApplicationProxy
$tenantConfig = $SSP.GetAnalyticsTenantConfiguration([Guid]::Empty)
$event = $tenantConfig.EventTypeDefinitions | where-object { $_.EventTypeId -eq <EventTypeId> }
$event
<EventTypeId> is the numeric EventTypeId of the usage event that you want to view. In the example below, I want to view the Views event, so I entered 1.

The Recent time period is defined by the RecentPopularityTimeframe property. You can change the Recent time period to be anything between one and 14 days. To change the time period, do the following:
1. In the SharePoint 2013 Management Shell, at the Windows PowerShell command prompt, type these commands:
$SSP = Get-SPEnterpriseSearchServiceApplicationProxy
$tenantConfig = $SSP.GetAnalyticsTenantConfiguration([Guid]::Empty)
$event = $tenantConfig.EventTypeDefinitions | where-object { $_.EventTypeId -eq <EventTypeId> }
$event.RecentPopularityTimeFrame = <TimeFrame>
$tenantConfig.Update($SSP)
<EventTypeId> is the numeric EventTypeId of the usage event that you want to change, and <TimeFrame> is the new time period you want to set for the usage event.
In the example below, I wanted to change the Views Recent time to a week, so I entered 1 and 7.
2. To verify the change, at the Windows PowerShell command prompt, type the following command:
$event
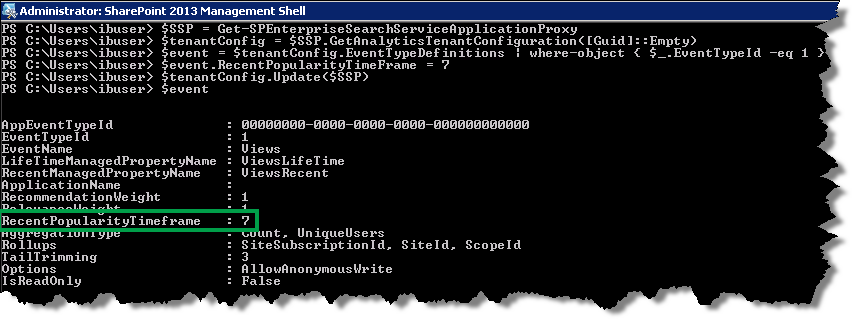
Notice that the value for the RecentPopularityTimeframe parameter has changed to 7.
Narrow the Most Popular Items report to a specific attribute or category
Viewing usage reports per usage event is useful when you want to find out how visitors are interacting with your site. But many times you want to narrow the report to a specific attribute or category, for example all items that are on sale or all Laptops. To do this, you can use Keyword Query Language (KQL). If you don’t know KQL, don’t worry. You can easily narrow your Most Popular Items report without having much knowledge of KQL.
In our Contoso catalog, we have a site column called RetOnSale. For each item, the value of RetOnSale specifies if the item is on sale or not.

To narrow the Most Popular Items report to only show items that are on sale, we’ll use the managed property that represents the RetOnSale site column. In our Contoso scenario, this is RetOnSale (in another blog post I explain how you can find a managed property name).
In the Search Schema, we can see that the RetOnSale managed property is Queryable. This means that we can use it to narrow the Most Popular Items report.

To see Views usage event statistics for items that are on sale, on the Most Popular Items page, select Most Views, and enter RetOnSale=True.
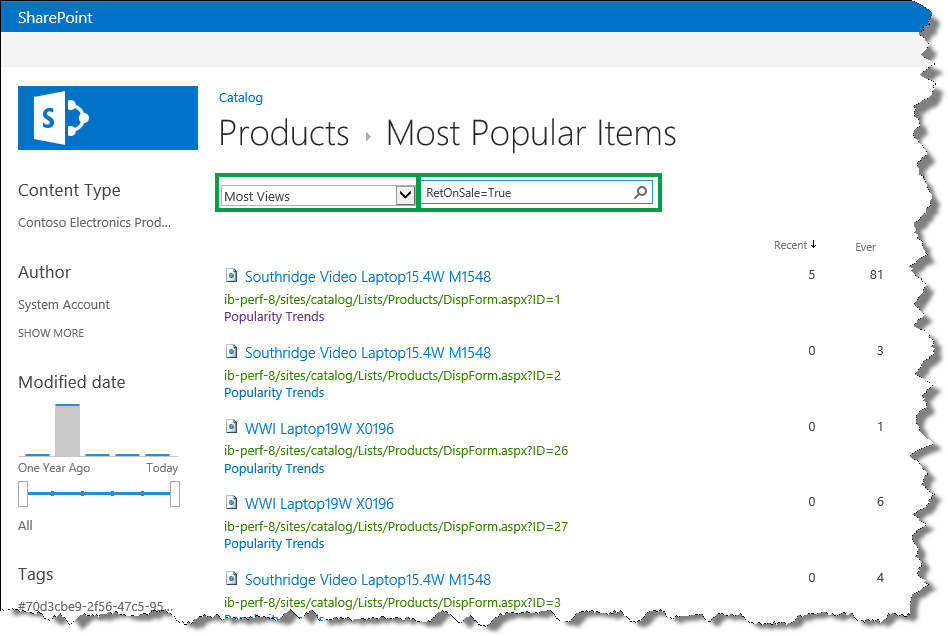
And just like that, only items that are on sale are shown.
You can also narrow usage event statistics to a specific category, for example all Laptops. In our Contoso scenario, the Item Category site column is used to specify the category for each item.

The managed property name of the Item Category column is owstaxIdProductCatalogItemCategory. The owstaxIdProductCatalogItemCategory managed property is queryable, which means that we can use it to narrow the Most Popular Items report.
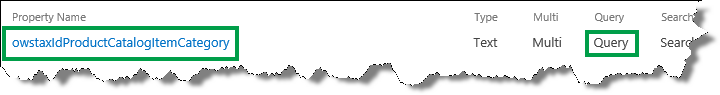
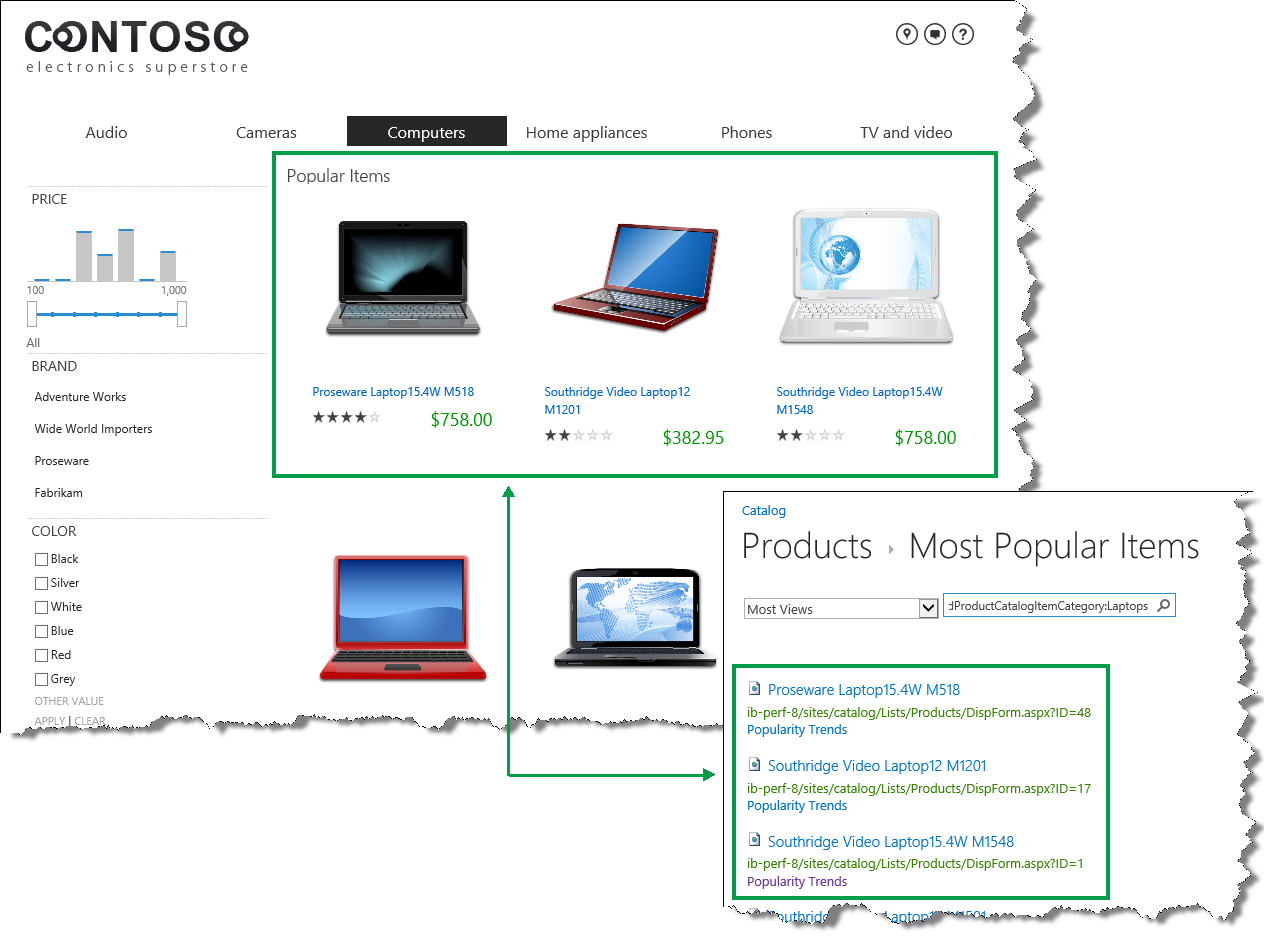
To see which laptops are viewed most by visitors, on the Most Popular Items page, select Most Views, and enter owstaxIdProductCatalogItemCategory:Laptops

By narrowing the Views usage event statistics to a specific category, we can verify that the Popular Items Web Part is working correctly on our publishing site. For example, on the Laptops page, notice that the three items that are displayed in the Popular Items Web Part are the same that are shown to have the most Views in the Most Popular Items report that we just narrowed to Laptops.
View the Popularity Trends report for an item
There are two ways you can access the Popularity Trends report for an item:
a. On your catalog, select the item for which want to view the Popularity Trends report. In the ribbon, click ITEMS --> Popularity Trends.

b. On the Most Popular Items page, click Popularity Trends.

Both of these options will open a Microsoft Excel sheet where you can view the daily and monthly statistics for the item. Each usage event is shown in a separate tab.

About the TailTrimming parameter
While we’re on the subject of usage analytics reports, one usage event parameter that is worth mentioning is TailTrimming. This parameter specifies when the numbers that are shown in the usage analytics reports should be updated.
IMPORTANT: This parameter does not affect how recommendations are calculated.
For example, for the Views usage event the TailTrimming parameter is by default set to 3.
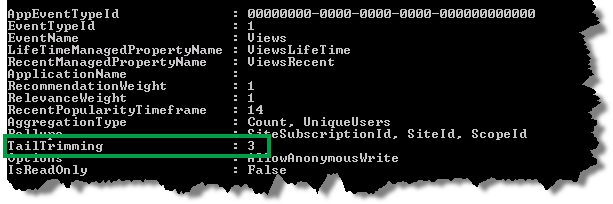
This means that the usage analytics reports will be updated for an item when the item has been viewed a minimum three times within the last 24 hours. For example, if the item Fabrikam Laptop16 M6000 has been viewed twice within the last 24 hours, these two views won’t show up in the usage analytics reports. If within the next 24 hours the Fabrikam Laptop16 M6000 item is viewed 4 times, the usage analytics report will be updated with 4 views.
The reason the TailTrimming parameter is set to 3 is to avoid having to update items that almost none of your website visitors are interacting with. By not updating these items, you reduce the load on your system. On the other hand, when the TailTrimming parameter is set to 3, the usage analytics reports can be somewhat inaccurate. In the example with the Fabrikam Laptop16 M6000, the two views in the first 24 hours will not show up in the usage analytic reports. Total number of views of Fabrikam Laptop16 M6000 over the last 48 hours will show 4, but in reality, it was viewed 6 times.
If you want the usage analytics reports to be updated regardless of minimum amount of views within the last 24 hours, do the following:
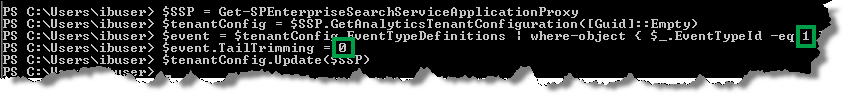
1. In the SharePoint 2013 Management Shell, at the Windows PowerShell command prompt, type these commands:
$SSP = Get-SPEnterpriseSearchServiceApplicationProxy
$tenantConfig = $SSP.GetAnalyticsTenantConfiguration([Guid]::Empty)
$event = $tenantConfig.EventTypeDefinitions | where-object { $_.EventTypeId -eq <EventTypeId> }
$event.TailTrimming = <TailTrimming>
$tenantConfig.Update($SSP)
Where <EventTypeId> is the numeric EventTypeId of the usage event that you want to change, and <TailTrimming> is the minimum amount of times the usage event has to occur within 24 hours for the usage analytics reports to be updated.
In the example below I wanted the usage analytics reports for the Views usage event to be updated if a Views usage event occurs within 24 hours, so I entered 1 and 0.
2. To verify the change, at the Windows PowerShell command prompt, type the following command:
$event

Notice that the value of the TailTrimming parameter has changed to 0.
So with that, this series has come to an end. Hopefully you now have a better understanding of how recommendations and popular items work, and can start adding them to your website.
Comments
Anonymous
January 01, 2003
I see a "Reports and Data Search Support" site collection feature in my SharePoint Online sites but it is not activate. I cannot find any guidance about when this should be activated. Should it be activated in a Search Center, a teams site collection or what? Can you provided any information about this feature? TIA
DeanAnonymous
January 01, 2003
The comment has been removedAnonymous
January 01, 2003
very interested articles indeedAnonymous
January 01, 2003
Hi Mohi,
There is no default option to automatically send Usage reports to users.
BellaAnonymous
January 01, 2003
Hi Barry,
It's difficult to say what could be causing this issue. I suggest that you contact Microsoft Support.
BellaAnonymous
January 01, 2003
Hi David,
Yes, you can use these properties when you configure the query in the Search Results Web Part.
BellaAnonymous
January 01, 2003
Hi Matrix,
Sorry, I don't quite understand exactly what type of report you're looking for. Do you want anything beyond the reports that are based on "Most Views" or "Most Views by Unique Users"?
Thanks,
BellaAnonymous
January 01, 2003
Hi Rob,
I'm not sure I quite understand your question, but the usage analytics report shows a daily count of unique users per usage event type. For more information, see this TechNet article:http://technet.microsoft.com/en-us/library/jj715890(v=office.15).aspx
Hope this helps,
BellaAnonymous
January 01, 2003
Hi John,
No, you can't set the Recent time period to be more than 14 days.
BellaAnonymous
January 01, 2003
Hi David,
ViewsRecent is part of Usage Analytics, which is only available in SharePoint Server 2013 Enterprise. Rank is available in all SharePoint versions.
You can sort on these properties either by: Changing ranked search results in a query rule: http://technet.microsoft.com/en-us/library/jj871014(v=office.15).aspx#BKMK_ChangeRankedSearchResults,Transforming the query in the result source: http://technet.microsoft.com/en-us/library/jj715262(v=office.15).aspx, orChanging the sorting of the search results in the Search Results Web Part: http://technet.microsoft.com/en-us/library/gg549987(v=office.15).aspx
Hope this helps,
BellaAnonymous
January 01, 2003
The comment has been removedAnonymous
January 01, 2003
Hi Bella,
We encountering actually a problem with the Analytics Report on our intranet. We built a dedicated service farm that contains the published search service application. The WCM farm consume this published search service app. The analytics datas are present on the service farm but when we ran the site collection reports(in the WCM farm), we don't have any data.
Do you have any idea to get the serviice farm data on the consuming farm?
Thanks a lot
ChristopheAnonymous
January 01, 2003
Hi Christophe,
I'm sorry, but I don't know how you should do this.
I suggest that you contact Microsoft Support with your question,
BellaAnonymous
January 01, 2003
Hi BlueSky2010,
As I understand you, you get this error message in the Popular Items Web Part on your publishing site, correct?
If so, in your catalog, can you see counts for your Most Popular Items (http://blogs.technet.com/b/tothesharepoint/archive/2014/01/28/view-and-configure-usage-analytics-reports-in-sharepoint-server-2013.aspx#ViewMPI)?
BellaAnonymous
January 01, 2003
Hi Bella - great article and even better support!! :-)
I ran into a strange issue with 'Most Popular Items' report. One user with full control permission gets "this query returned no results" message. I can't reproduce this issue with Site collection admin privilege or with the same permission as the user. Any suggestion as to what to check next? As far as I can see it's happening on more than one library.
Appreciate any feedback!Anonymous
January 01, 2003
Hi Vikas,
I'm sorry, but I'm not quite sure about the answer to your question. I suggest you contact Microsoft Support.
Thanks,
BellaAnonymous
January 01, 2003
Hi elie,
I'm sorry, but I don't quite understand your question. What do you mean when you say that the property values are always null? Is you Most Popular Items report not showing any views?
Thanks,
BellaAnonymous
January 01, 2003
Nice Blog ....Thanks..Anonymous
January 01, 2003
Hi Brian,
I'm not that familiar with the analytics features in SharePoint 2010, so I'm not quite sure what kind of custom reports you're looking for.
I suggest you contact Microsoft Support.
BellaAnonymous
February 07, 2014
226 Microsoft Team blogs searched, 30 blogs have new articles. 102 new articles found searching fromAnonymous
February 21, 2014
Recent Releases :
Updates: Process Explorer v16.0, PsPing v2.01 - 29-Jan-2014
Released: ManagementAnonymous
April 24, 2014
This is nice. Thank youAnonymous
June 10, 2014
Does the ViewsRecent and Rank sorting property work on a Search Results webpart in SharePoint 2013 Sever?Anonymous
June 11, 2014
Thanks Bella for your reply, and are this properties (ViewsRecent and Rank) available on all SharePoint versions? Standard for instance? Is there something specific that need to be enabled to allow sorting using this properties?
Thanks is advance!
DavidAnonymous
June 18, 2014
Hi Bella,
I have a requirement where I need to show statistics of a publishing page for last 30 days from today.
I previously tried using 'ViewsLastMonths1Unique' but it is returning the statistics for current calendar moth only and not last 30 days from today.
Also if it is not possible without customization do we have REST API to get the statistics details of page by providing some query
Best Regards,
Prasad PathakAnonymous
August 05, 2014
Hi Bella, that's a great piece of information ! Thank you.
In the section "•Change the Recent time period for a usage event", my question is- can we increase the number of days to be more than 14.
Thanks.
JohnAnonymous
August 14, 2014
The comment has been removedAnonymous
September 08, 2014
Can we generate reports for anonymous users who access the site from public network? If yes, how can we do that?Anonymous
October 09, 2014
The comment has been removedAnonymous
November 24, 2014
Our Analytics is always returning massivley inaccurate results with thousands of hits on pages noone interacts with. I think it might be down to the search account possibly being noted as a user, is there any way to prevent this?Anonymous
January 06, 2015
I am facing a problem with search usage reports. I am getting 'query text' column value empty in 'top queries by month' report.
I have raised a question on SP 2013 forum here -
https://social.msdn.microsoft.com/Forums/office/en-US/f75ddec7-1d06-4e81-9998-82811650d8e5/sharepoint-2013-search-analytics-reports-query-text-column-value-is-empty-in-top-queries-by?forum=sharepointgeneral
Please refer the forum post to find more details. If you have some clue, can you please put comment on the forum itself or here?
Thanks in advance.
MahavirAnonymous
February 16, 2015
Hi Bella,
The usage reporting is activated on my SharePoint server. However, the views managed properties such as ViewsLifeTime , ViewsRecent, ViewsLast7Days are always null. I have looked into their definition and I find that they do not any associated crawled properties. Is this normal? Am I missing something?
Thank you in advance.Anonymous
February 19, 2015
I am not getting the usage report for a web application and found that the URL of the web application mentioned in the Content Source is of Intranet Zone (not extended) which is different to the Default Public URL. Will this affect in generating the Usage Report?Anonymous
April 13, 2015
How does it work with a dedicated search farm. The statistics are presne on the search farm but the report on local farm are empty.
Any idea for this topics?
Christophe