How to view EMS security telemetry - Part 1
Enterprise Mobility & Security encompasses a number of features that contain a rich seam of security related information that can be viewed or accessed via a number of different methods. This article will be split into 3 posts covering each of the main areas of EMS:
- Azure Active Directory
- Azure Information Protection
- Intune
Before going any further an outline knowledge of Graph API is needed. A high level view can be found here. Essentially all user activities within the Azure EMS service are audited to some degree. This also includes interactions within the Office 365 suite of services. All these separate services have an API that can be called to extract this information as needed. However, the APIs are now being grouped under one super API to rule them all, Microsoft Graph.
Currently the APIs of interest are in the beta section of Microsoft Graph and cover the following:
- Directory (Azure AD, in v1.0 & beta)
- Privileged Identity Management (part of Azure AD Premium 2)
- Identity Protection (part of Azure AD Premium 2)
- Intune
The website includes a basic Graph Explorer interface to query this set of data, but this article looks at a different method of visualising aspects of this data.
Part 1 - Azure Active Directory
Azure Active Directory is the foundation service that underpins all user activity within the Azure cloud space which includes the EMS features but also includes Office 365 and Dynamics as well. All user authentication activities are logged for 30 days and the data can be extracted via Graph API for a local SIEM (Security Information Event Management) to consume as required.
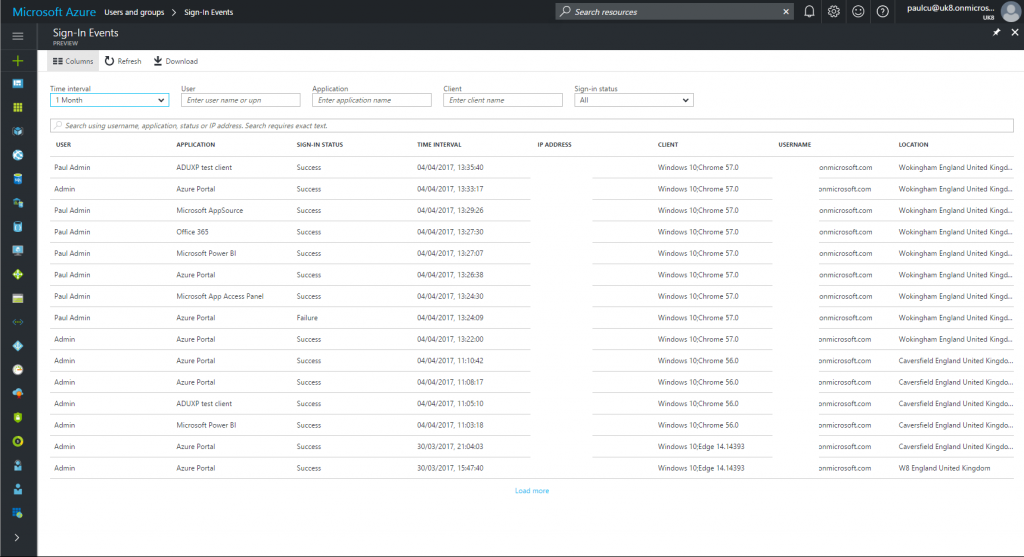
Through the (new) Azure Portal there are three core areas of reporting, all of these can be found in the 'Azure Active Directory' blade. They are:
- Enterprise applications - which users have logged into which application
- Sign-ins - as above but not filtered by app
- Audit logs - what actions has the user account carried out
[caption id="attachment_2065" align="aligncenter" width="1024"] Sign-ins activity blade[/caption]
This article looks to use a different interface from the screen shot above that was taken from the new Azure portal. Note this article looks at Microsoft Graph API only, not the older Azure Active Directory Audit API that formed part of the Azure Classic interface.
The maximum retention period for this data is 30 days and a Azure Activity Directory Premium 1 license is required which forms part of the EMS license package.
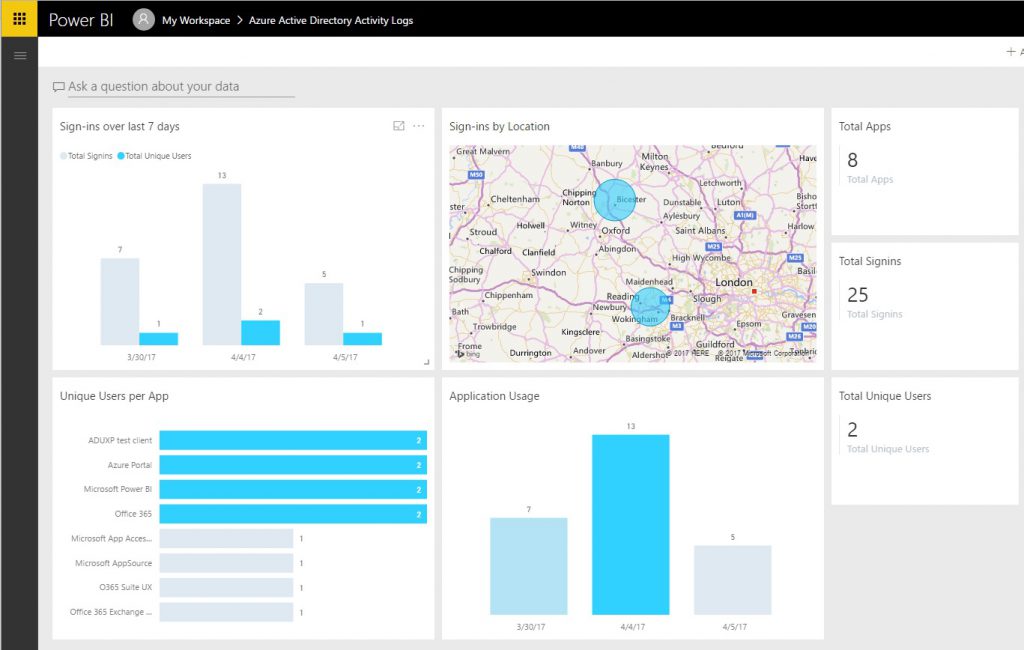
Another view on this audit data is to use PowerBI. The new Azure Portal is still in Public Preview (though expected to hit General Availability (GA) very soon) and there is a PowerBI Content Pack (also in preview) to view this audit data.
To access this visualisation you will need an admin level tenant account (or one with the security read role) and open a web page to https://powerbi.microsoft.com and sign in with the admin account. Accept the standard authentication requests and it should load up a blank dashboard. There is a small arrow in the bottom left corner (Get Data), on the Services pane click 'Get' and select 'Azure Active Directory Activity Logs (Preview)'. PowerBI will ask for some details around your tenant and account to use to load the data. Once complete the dashboard will display a summary of the last 30 days of Azure AD information.
The dashboard should look similar to this:
[caption id="attachment_2075" align="aligncenter" width="1024"] Azure AD content pack landing page[/caption]
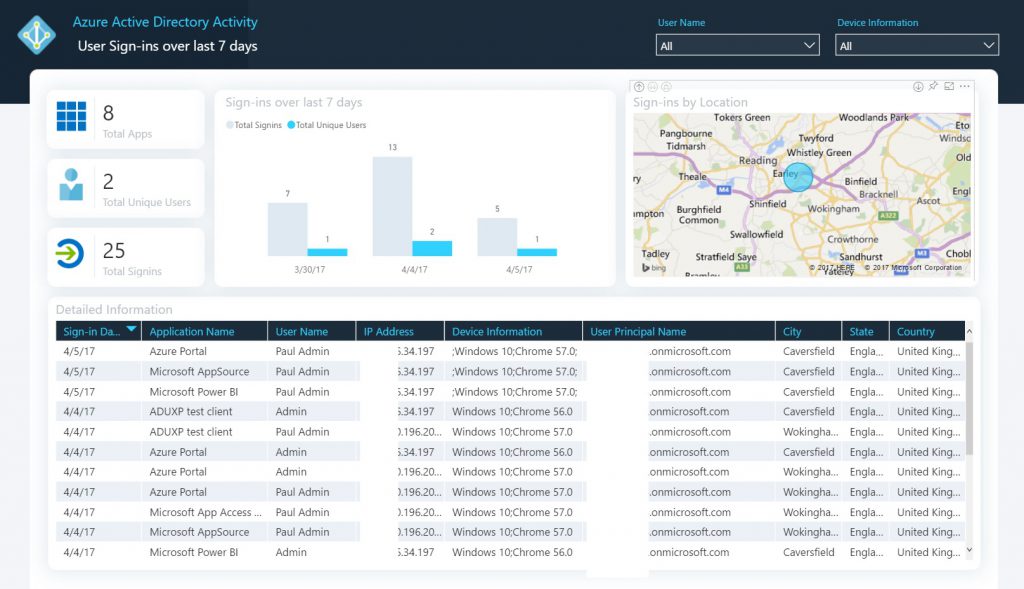
Clicking on the various panels will focus the information on that area, such as:
[caption id="attachment_2085" align="aligncenter" width="1024"] Sign-ins focus page[/caption]
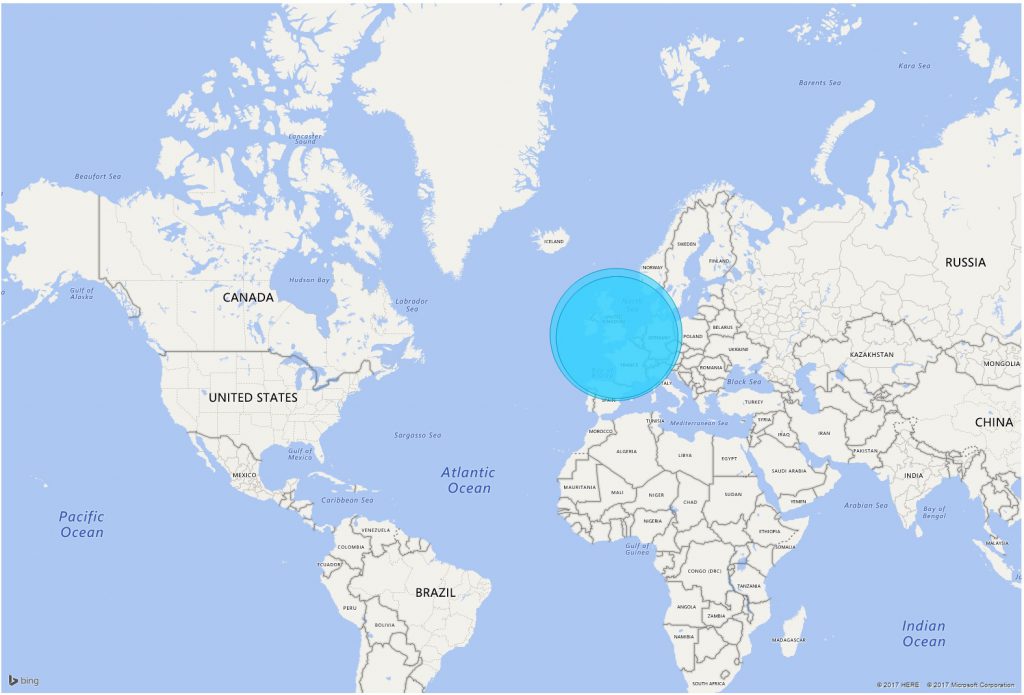
And the world map can be pinched and zoomed to see where people are logging on from on a global basis with the map occupying the whole screen:
[caption id="attachment_2076" align="aligncenter" width="1024"] Global login locations[/caption]
Elements of the sign-in activity data is available even on the free versions of Azure AD - these only show the last 7 days of activity (as shown in the screenshots above), with EMS the data retention period is 30 days. Audit activity is shown in the portal and reports around 15-60 mins after the event. If more than 30 days of days worth is required, then an on premise log collection system will be needed (normally a SIEM) and up to the most recent 120,000 (or 30 days worth) events can be downloaded to this on premise platform.
Finally more information of the classes of information that is retained can be found here.