Data Stories Brought to Life: Power BI in the Public Sector
Within public sector data interfaces between similar and dissimilar systems is very common. For example having 1 system that's key to your customers, such as your CRM system and linking this with financial, revenue and benefit systems.
How you get a clear view of what's happening within your data environment today across all of the departments and sections? Do you have the facility for real time dashboards to see how your organisation is working?
Power BI is a tool from Microsoft that transforms your company's data across the board into rich visuals for you to collect, organise, filter and focus on what matters to you.
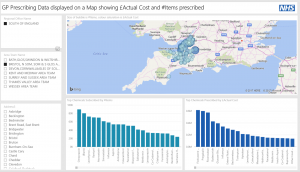
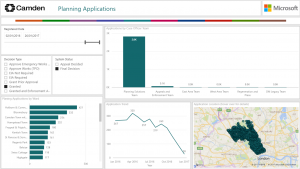
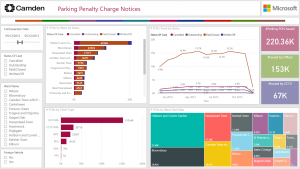
To explain this even further, lets show you. Below are examples of how data can be manipulated in a way that you understand. For example the local government link illustrates very large data sets for crime, road collisions, trees and planning.
Overview Gallery: https://community.powerbi.com/t5/Data-Stories-Gallery/bd-p/DataStoriesGallery?sortby=postdate
Police Services: https://community.powerbi.com/t5/Data-Stories-Gallery/UK-Public-Sector-Police-Services/m-p/120360
Local & Regional Government: https://community.powerbi.com/t5/Data-Stories-Gallery/UK-Public-Sector-Local-amp-Regional-Government/m-p/120229
Primary Care: https://community.powerbi.com/t5/Data-Stories-Gallery/UK-Public-Sector-Primary-Care/m-p/120381


