Note
Access to this page requires authorization. You can try signing in or changing directories.
Access to this page requires authorization. You can try changing directories.
This document may be helpful when setting up SQL profiler tracing on Lync/SFB servers.
Identify the Lync SPROC which is possibly causing the issue. You can find the SPROC reference normally in User service CLS logging /queries etc. Navigate to backend SQL database and make a note of the SPROC name.
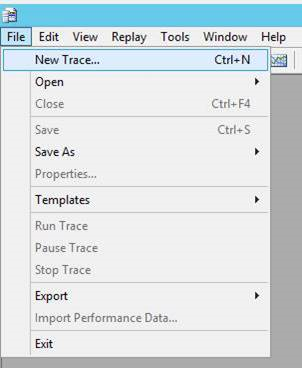
Open SQL server profiler on the SQL backend server. Click File > Template > New Template.
Select the relevant SQL version and enter a template name.
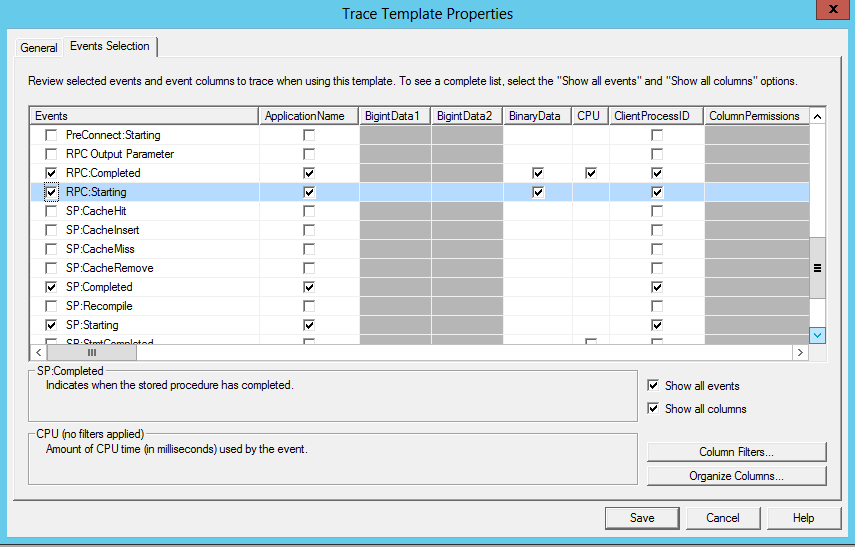
Select the condition for profiler trace like SRPC start/end , RPC start/end etc.
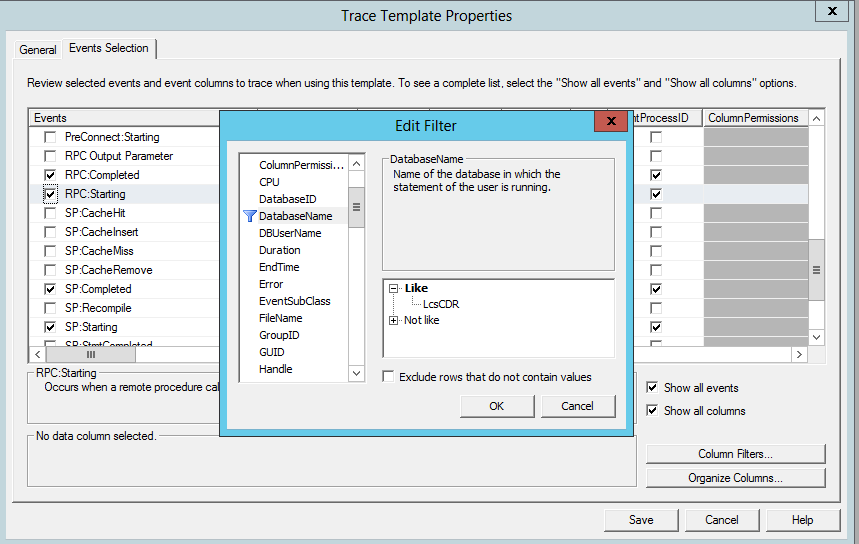
Click on the Column filter tab on right hand side bottom page, select the database name and enter the Lync/SFB database and click OK.
Navigate to Objectname and enter the SPROC like below and click OK.
Save the template. Navigate to File > Template > export template.
Save the template locally for future or sending to customers etc. You can import the saved template in another SQL server and start the tracing.
If you need custom configuration like circular logging , location etc.
Connect to the SQL instance where in database/SPROC is located.
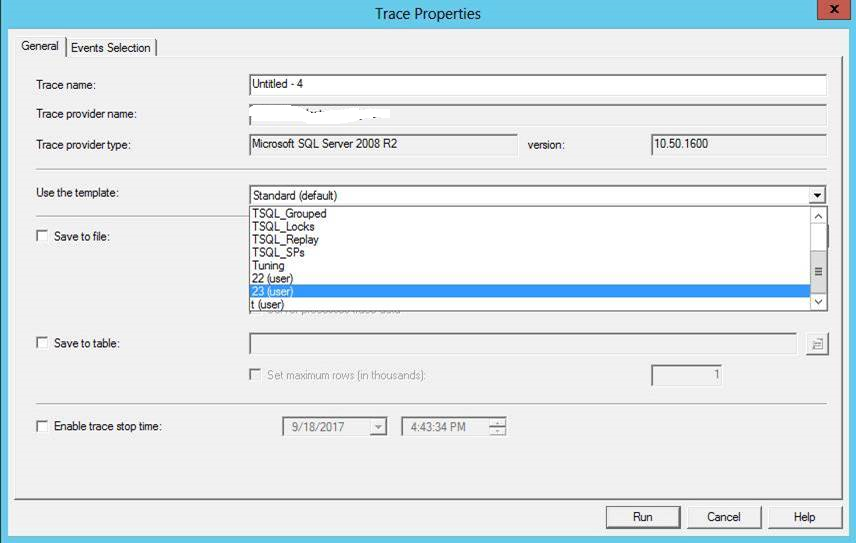
Run the profiler trace with new saved template.
While it was running , navigate to File > export > Script trace definition> SQL version.

Save the profiler template as a script and modify the maxfilesize and InsertFileNameHere to make the logging circular. You can find start/stop steps ;https://blogs.technet.microsoft.com/beatrice_popa/2013/01/16/how-to-capture-a-circular-sql-server-profiler-trace/


