Enabling Tracing during TFS 2010 Configuration
Please note: this post applies only to Team Foundation Server 2010 (Beta 1 to current). It does not apply to TFS 2005, 2008 or any future version (though I suspect that any future version would have similar capabilities).
Were you asked to enable tracing during TFS configuration? Is the configuration process crashing and not leaving around a sensible log (What? That can’t happen!). Are you just really curious about what is happening during configuration and want to see all the gory details?
I’ll repeat this several times in this post – the tracing we are enabling is for the Application Tier configuration tools only. These steps take place on your Application Tier but in NO WAY do they affect the TFS services performance or behaviors – this includes the web services, build services, job agent service and anything else that is not tfsconfig.exe or tfsmgmt.exe (i.e. the command line and GUI based TFS 2010 configuration tools).
If so – this is the post you’re looking for.
Enabling Tracing
- Close the TFS 2010 configuration wizard or admin console (if running).
- We only check the trace level when the program starts up. So if it’s already running and you haven’t done this – you need to close it!
- Oh – if you are running the TFS 2010 Setup and are at the window where you are asked if you want to launch the configuration tool – you can update the registry key now and not need to close the configuration wizard since the MSI and configuration phases are separate executables).
- Enable verbose tracing by doing the following:
- Open Regedit (must be an Administrator)
- Find the key HKLM\SOFTWARE\Microsoft\TeamFoundationServer\10.0\Admin
- Edit the value “TraceLevel” (DWORD) – set to “4” (it is probably “0”)
- You can do this from an admin command prompt by running:
- reg.exe add HKLM\SOFTWARE\Microsoft\TeamFoundationServer\10.0\Admin /t REG_DWORD /v TraceLevel /d 4 /f
- Run DbgView
- You can download DbgView from https://technet.microsoft.com/en-us/sysinternals/bb896647.aspx
- You can also run it right from the website at this link: https://live.sysinternals.com/Dbgview.exe
- You can download DbgView from https://technet.microsoft.com/en-us/sysinternals/bb896647.aspx
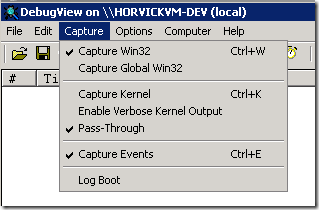
- By default DbgView is ready to go – Under the “Capture” menu make sure that “Capture Win32” (CTRL+W), “Pass-Through” and “Capture Events” (CTRL+E) are enabled. Nothing else is needed.
- Start up the TFS Administration Console (or configuration tool, whatever).
When the config tool starts you should see some data streaming in to DbgView – it should look something like this:
[6468] Admin TraceLevel = Verbose
Hooray! Tracing is enabled!!!!
Show Me The Errors!
- Bring up the filters screen in DbgView (CTRL+L or clicking on this button:
 ).
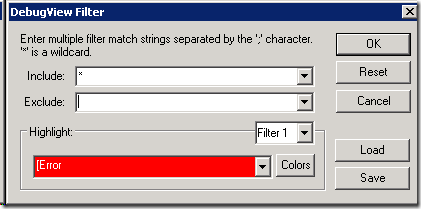
). - Leave the Include and Exclude fields alone.
- In the Highlight section leave “Filter 1” selected and type “[Error” into the Red text area (please note that I typed an opened brace but not a closing one and also do not type the double quotes). It should look like this:
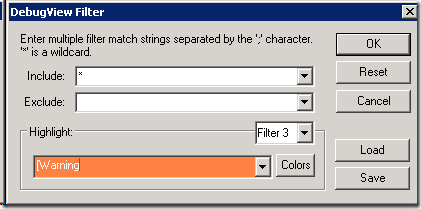
- Now change “Filter 1” to “Filter 3” (Nothing magically about 3. I use 3 because it’s kind of orange – I don’t like the purple of “Filter 2” and I don’t want to get into color changing in this blog post – you want to change colors? Go nuts.).
- Add the string “[Warning” – again, no closing brace and don’t use the double quotes.
- Now if you happen to have an error it will be much easier to detect.
Ok … so why am I doing this?
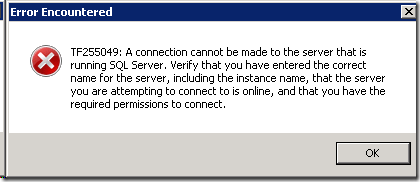
Let me give you an example of why. Let’s say in the Advanced Configuration Wizard you type in the wrong name of the SQL Server Instance you want to use. The error message you will get is:
But look at some of the trace output:
[6468] [Verbose@18:45:56.241] Checking if database master exists on SQL connection Data Source=HORVICKVM-DEV2;Integrated Security=True
[6468] [Error @18:46:21.381] Microsoft.TeamFoundation.Admin.TfsAdminException: TF255049: A connection cannot be made to the server that is running SQL Server. Verify that you have entered the correct name for the server, including the instance name, that the server you are attempting to connect to is online, and that you have the required permissions to connect. ---> Microsoft.TeamFoundation.Framework.Server.DatabaseConnectionException: TF246017: Team Foundation Server could not connect to the database. Verify that the server that is hosting the database is operational, and that network problems are not blocking communication with the server. ---> System.Data.SqlClient.SqlException: A network-related or instance-specific error occurred while establishing a connection to SQL Server. The server was not found or was not accessible. Verify that the instance name is correct and that SQL Server is configured to allow remote connections. (provider: Named Pipes Provider, error: 40 - Could not open a connection to SQL Server)
What’s so great?
Well first the error message is highlighted red (in DbgView it will be white text on a red background given my example above – but here I made it red text on white to be more readable in the blog post).
Also the message contains the true .NET Exception that occurred and the connection string we used. Those are two really useful pieces of information when you are trying to figure out what is happening. More specifically it even told you how the check was being performed (“Checking if database master exists…”).
Oh No! I have Warnings and Errors!
Well – did anything actually go wrong with your configuration? If not – then it’s probably nothing to worry about. We have some messages that come out as warnings or errors but are in fact benign.
Why Don’t I See Server Messages?
This blog post only explains how to enable tracing for the TFS 2010 admin tools. It does not explain how to enable tracing for the server components, SQL, the job service (though we do trace the job service output when a servicing operation is initiated by an admin tool such as tfsmgmt.exe or tfsconfig.exe). This trace data will provide you zero insight into your server’s realtime activities. Only configuration actions.
Should I Leave It This Way?
No, probably not. It’s meant as a debugging aid.
We do perform tests with tracing enabled (it is constantly enabled on all my machines) – but it’s not the “pure” way to keep your system.
That said…
Tracing in no way affects your server performance. I repeat (again and again) – enabling tracing in no way affects your TFS server performance. Nor does it affect the operational behavior of any TFS feature or service (other than itself, obviously).
It could negligibly impact the configuration tool performance. But do you think tracing out a string is more or less expensive than creating a connection to a remote SQL server and executing tens of SQL scripts? It’s not even close. Tracing is orders of magnitude cheaper than most of our configuration actions.
I personally keep DbgView open 24/7 on my machines and any time something goes wrong I pop it open and see what happened. That’s how I roll. I’m wild like that.


