Monitoring Client-Outbound WCF Calls
Recently a colleague asked me if I knew of a way to monitor outbound WCF calls for an application. He just wanted to be able to see the number of outbound calls an application was making. Performance Monitor normally provides the answer to these kinds of questions. Unfortunately, the performance counters for WCF are primarily server side (incoming) counters. No problem – just add a custom performance counter. Well, that is great if you have the luxury of being able to modify the application to populate the new counter. Unfortunately, this luxury didn’t exist either. So, what can we do?
While working on another issue, I stumbled onto this little event, 218 – ClientOperationCompleted, that is one of the WCF events emitted in Analytic Tracing with ETW. With this I am able to see outbound calls, and even filter the calls down to a particular service contract, process, or even destination address. Here is the solution I came up with.
Open the Windows Event Viewer.
Expand out Applications and Services Logs > Microsoft > Windows.
Right-click on Application Server-Applications and select View > Show Analytic and Debug Logs.
Right-click on Analytics under the Application Server-Applications folder and select Enable Log.
Right-click on Analytics again and this time select Filter Current Log…
In the Filter Current Log dialog, enter 218 for the Event ID and click OK.
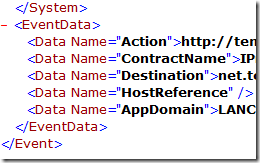
While this filters the events to those with ID 218, it still may not deliver what you want. For example, after turning this on and executing a couple of WCF calls from my client, I noticed there were over 100 events (from other applications running on my machine). I really only wanted to see the events from my client application I’m interested in. If you drill into one of the events you can see the EventData available to query on. For example, Action, ContractName, Destination, AppDomain are ones I found useful.
Having this information, it’s possible to write a query to provide exactly what I want.
Right-click on Analytics again and select Filter Current Log…
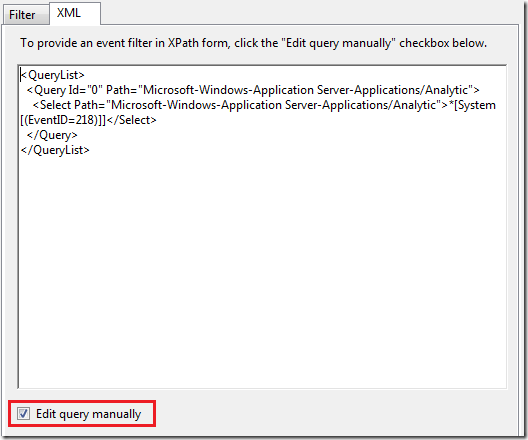
In the Filter Current Log dialog, click on the XML tab.
Click on the Edit query manually checkbox so you can edit the query directly.
Replace the query with your custom query. Here are a couple of examples to get started.
If you want to filter on outbound calls for a particular contract name…
<QueryList>
<Query Id="0" Path="Microsoft-Windows-Application Server-Applications/Analytic">
<Select Path="Microsoft-Windows-Application Server-Applications/Analytic">*[System[(EventID=218)]] and *[EventData[(Data[@Name="ContractName"]="YourServiceContractName")]]</Select>
</Query>
</QueryList>
If you want to filter on outbound calls for a particular process…
<QueryList>
<Query Id="0" Path="Microsoft-Windows-Application Server-Applications/Analytic">
<Select Path="Microsoft-Windows-Application Server-Applications/Analytic">*[System[(EventID=218)]] and *[EventData[(Data[@Name="AppDomain"]="yourprocess.exe")]]</Select>
</Query>
</QueryList>
You get the idea. You can adjust the query to meet your specific needs.


