New memory grant query hint MIN_GRANT_PERCENT came to rescue
In SQL Server 2012 SP3, we made supportability improvements in the memory grant space. One of the features (https://support.microsoft.com/en-us/kb/3107401) is allow you to hint your query (MIN_GRANT_PERCENT and MAX_GRANT_PERCENT), giving you much more granular control. There are additional columns related memory grants in sys.dm_exec_query_stats (https://support.microsoft.com/en-us/kb/3107398) and query_memory_grant_usage extended events to help troubleshoot memory grant issues.
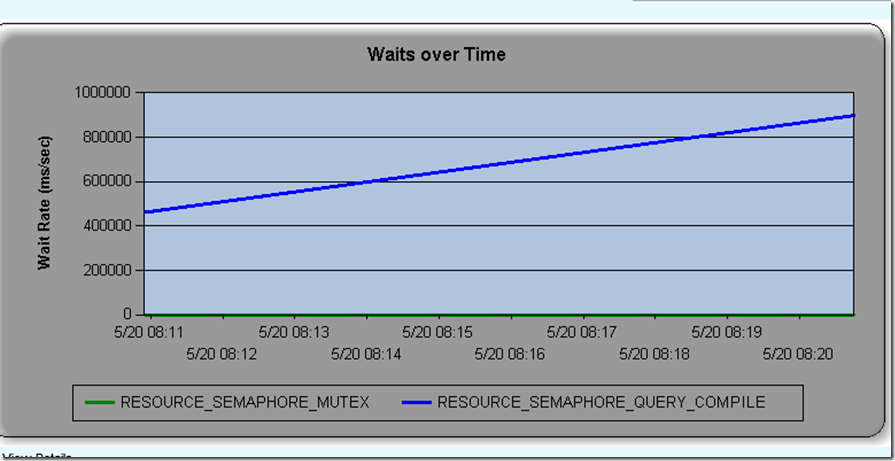
Recently, we had a customer who reported performance issues. The issue itself on surface is not related to memory grant. Rather, the wait is on RESOURCE_SEMAPHORE_QUERY_COMPILE.
From SQL Nexus bottleneck report, you can see the waits.
Before I go any further, let me differentiate memory grant and compile memory. The term memory grant refers to memory needed for query execution. Compile memory refers to the memory needed for optimization & compilation to generate a query plan.
In both cases, there are throttling mechanisms. Obviously you don’t want a runaway query to take down the server. If a query waits for memory to compile, the wait type is What RESOURCE_SEMAPHORE_QUERY_COMPILE. If a query waits for memory grants (execution), the wait type is RESOURCE_SEMAPHORE.
The customer has lots of waits on RESOURCE_SEMAPHORE_QUERY_COMPILE. To troubleshoot this, we have to look from two angles. First, did customer have many queries needing large amount of compile memory? Secondly, was it possible that other components used too much memory, causing the threshold lowered? In other words, if SQL Server had enough memory, those queries requiring same amount of compile memory would not have been put to wait.
We used this query and captured for several iterations of data to confirm that server didn’t have queries that required large amount of compile memory per se.
WITH XMLNAMESPACES ('https://schemas.microsoft.com/sqlserver/2004/07/showplan' AS sp)
select
stmt.stmt_details.value ('(./sp:QueryPlan/@CompileTime)[1]', 'int') 'CompileTime',
stmt.stmt_details.value ('(./sp:QueryPlan/@CompileMemory)[1]', 'int') 'CompileMemory',
SUBSTRING(replace(replace(stmt.stmt_details.value ('@StatementText', 'nvarchar(max)'), char(13), ' '), char(10), ' '), 1, 8000) 'Statement'
from ( SELECT query_plan as sqlplan FROM sys.dm_exec_cached_plans AS qs CROSS APPLY sys.dm_exec_query_plan(qs.plan_handle))
as p cross apply sqlplan.nodes('//sp:StmtSimple') as stmt (stmt_details)
order by 2 desc
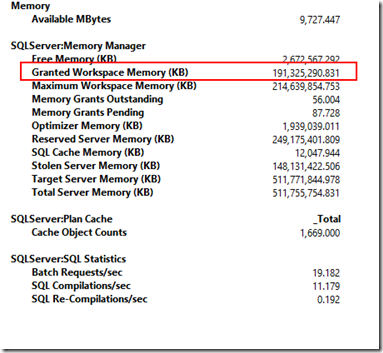
However, we saw huge memory grants (note about 190GB) at the time of the issue from perfmon.
Unfortunately we didn’t capture memory grant info for individual queries. But the new memory grant related columns in sys.dm_exec_query_stats (https://support.microsoft.com/en-us/kb/3107398) came to rescue.
We used this query to find out queries needing large memory grant.
SELECT top 50
total_worker_time, execution_count,total_logical_reads,total_elapsed_time,max_dop,total_grant_kb, max_grant_kb, total_used_grant_kb, max_used_grant_kb, total_ideal_grant_kb, max_ideal_grant_kb,
REPLACE (REPLACE (SUBSTRING (st.[text], qs.statement_start_offset/2 + 1,
CASE WHEN qs.statement_end_offset = -1 THEN LEN (CONVERT(nvarchar(max), st.[text]))
ELSE qs.statement_end_offset/2 - qs.statement_start_offset/2 + 1
END), CHAR(13), ' '), CHAR(10), ' ') statement_text
FROM sys.dm_exec_query_stats AS qs CROSS APPLY sys.dm_exec_sql_text(qs.sql_handle) st
order by max_grant_kb desc
Solution
We were able to find out the queries using large memory grants with the new columns in DMV sys.dm_exec_query_stats. But customer said that they didn’t have a good solution. He had tried to use resource governor. But that ended up throttling everyone in the pool. He only wanted to throttle a few queries that were run frequently.
Since they were on SQL 2012 SP3 build, we recommended MAX_GRANT_PERCENT per https://support.microsoft.com/en-us/kb/3107401. He used 3% and things have worked out perfectly for him.
Customer’s verbatim “We implemented the hint “max_grant_percent” on the business object queries that were taking the most memory and that seems to have really help. We set the percentage to 3 and now we are not seeing the resources semaphore query complies waits.”
Next time when you have memory grant issue, these query hints may come handy. By the way, these features are in SQL 2016 RTM and will be in SQL Server 2014 service pack release.
Jack Li |Senior Escalation Engineer | Microsoft SQL Server
Comments
- Anonymous
June 09, 2016
I am trying to run your script on a build 6523 SQL2015 server and it complains about the - in the ELSE qs.statement_end_offset/2 – qs.statement_start_offset/2 + 1 part of the script. Is there a problem with the script?- Anonymous
June 12, 2016
This is a copy and paste issue. Just remove the – and replace it with a new -. Also, you will have to replace the ‘ with '. Then the query works fine.- Anonymous
June 13, 2016
That was the problem. I had changed the ' with ' but not the -
- Anonymous
- Anonymous
- Anonymous
July 13, 2016
Regarding MAX_GRANT_PERCENT is the following statement in https://support.microsoft.com/en-us/kb/3107401 correct ?'If the size of this max memory limit is smaller than the required memory to run a query, the required memory is granted to the query.'So if the required memory is 5GB and the max memory limit works out to be 3.5GB then 5GB memory is granted to query. So what's the point of MAX_GRANT_PERCENT.That quoted statement in KB must be wrong. Unless I'm completely misunderstanding it.Thanks for any clarification.

