Note
Access to this page requires authorization. You can try signing in or changing directories.
Access to this page requires authorization. You can try changing directories.
We all know how easy it is to change the service tier of an Azure SQL database as the needs of your application change using the Azure Portal/PowerShell.
But what if you want to automate the upgrade and the downgrade of your database?
And, what if you have many databases and don’t want to be individually monitoring the DTU usage and then have to manually fire an upgrade?
You can achieve this using Azure Automation! Recently introduced as a public preview service, Azure Automation brings a powerful, much needed PowerShell Workflow execution service to the Azure platform.
In this blog, I’ll show you how to leverage the Azure Automation service combined with Alerts and Webhooks to accomplish a customer requested scenario- (To automatically scale up the DTU’s of the database only if there is a resource crunch)
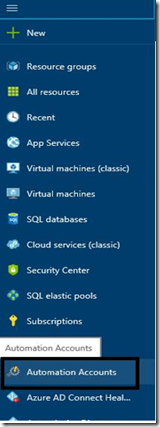
Step 1: Create your Automation Account:
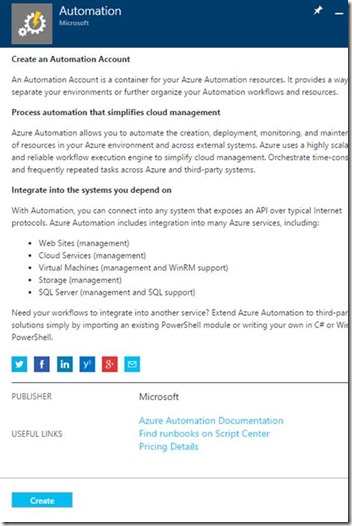
To do the Automation you have to create an automation account
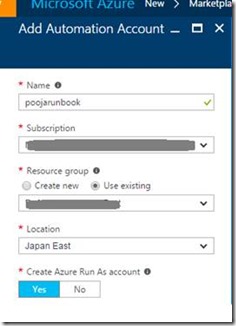
Add the details for your Automation account and proceed
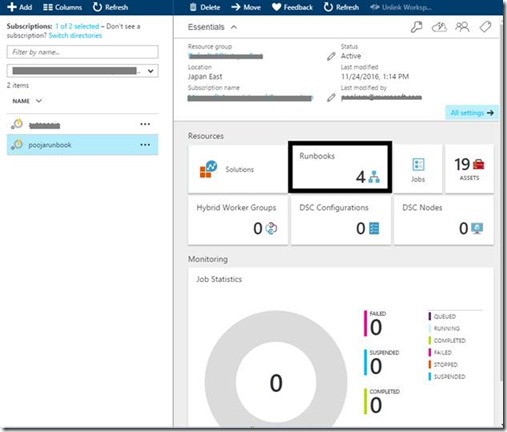
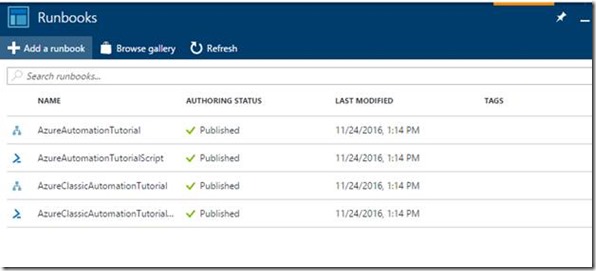
Step 2: Create a Runbook under the Automation account you created
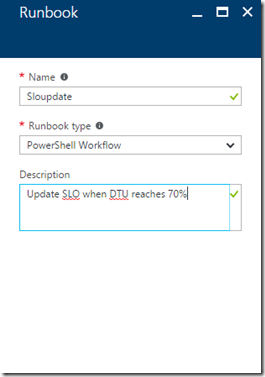
- Click on the Add a runbook button and then Create a new runbook with the Type “Powershell Workflow”
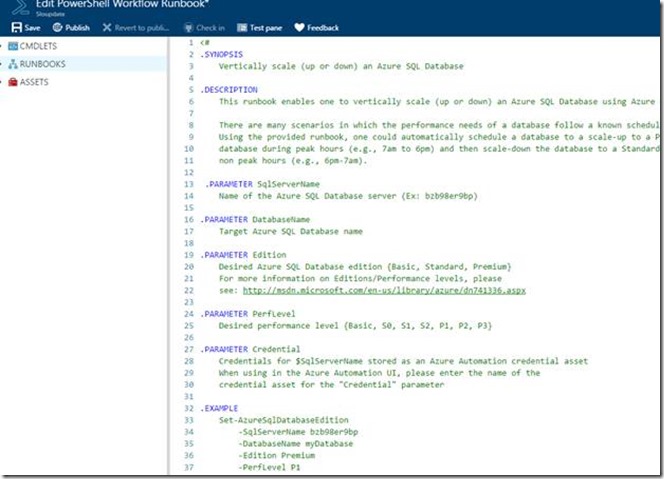
- Copy the UpdateSLO script from the below link (taken from the Powershell script gallery) to the run book.
- Save the run book after this.
https://gallery.technet.microsoft.com/scriptcenter/Azure-SQL-Database-e957354f
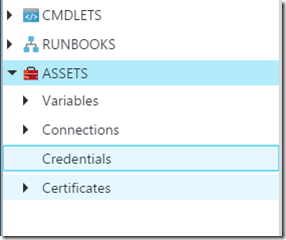
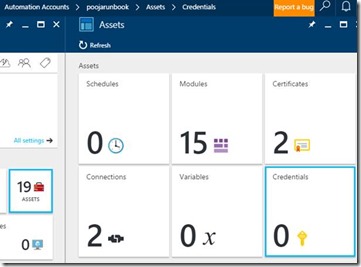
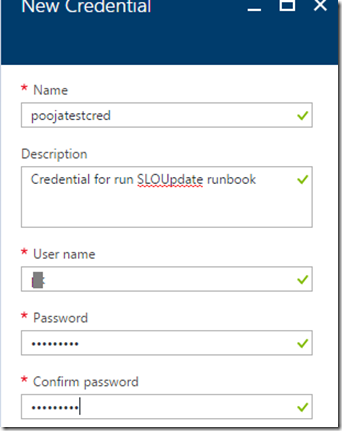
- Create a credential with the server admin user and password like the one mentioned in the below screenshot.
- Add a credential
- Fill in the details/ description for the New Credential
- Publish the Runbook once you have created the credential
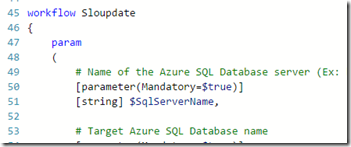
You may receive an error message like the below if you haven’t change the workflow name
Make sure the Workflow name in the script reflects the name of the runbook you created earlier to avoid the above error
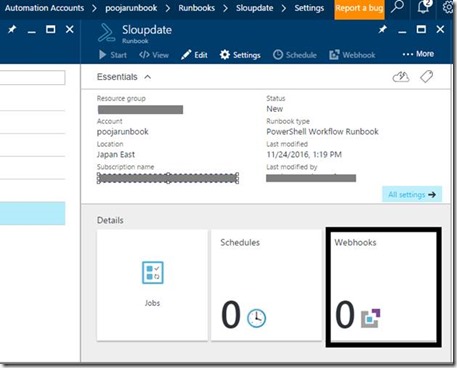
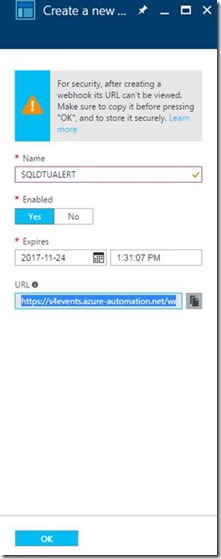
Step 3: Create a new Webhook
& copy the Webhook URL after the creation (Save it on a notepad for later use)
Webhooks allow you to route an Azure alert notification to other systems for post-processing or custom actions.
- Create the new Webhook
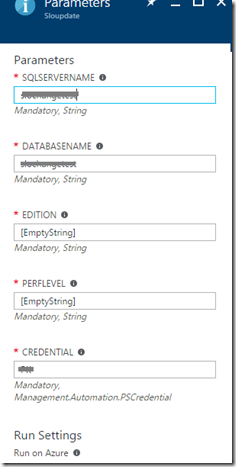
Edit the parameters of the Webhook to reflect the SQL Server name and the Database name we are configuring this for.
Use the Credential we configured earlier in the Credential tab.
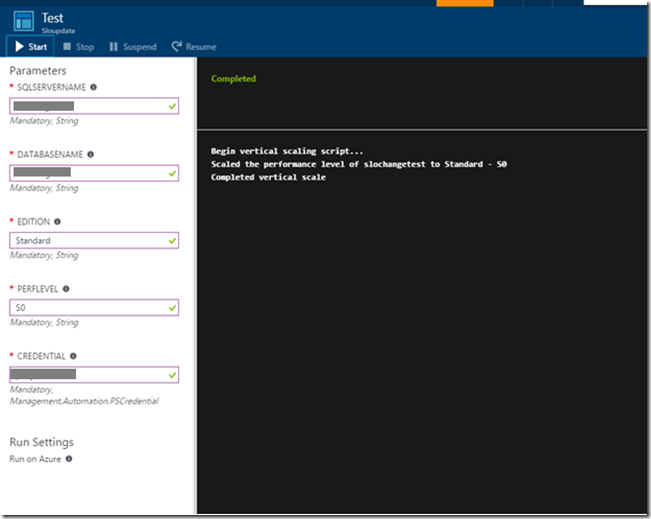
- I have a database that is usually in the Basic Edition and I would like to scale it to S1 when the DTU goes above 70% so I fill in the Edition parameter to Standard and PerfLevel to S0
- You can choose from the following based on your requirement
Edition: Basic, Standard, Premium
PerfLevel: Basic, S0, S1, S2, P1, P2, P3
· You can run a test (Which will not actually scale up the database, but will check if the workflow has any errors)
Step 3: Configuring the Alert to call the Webhook we created:
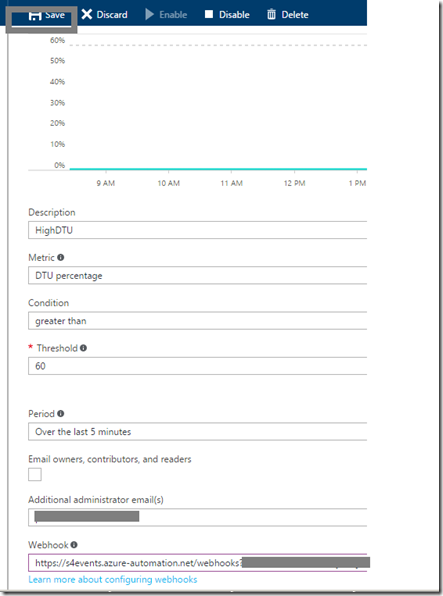
Now that we have our Webhook configured with the Runbook and we have tested it, we will need to configure an Alert to be able to call the webhook when it triggers due a condition being met.
You can configure an alert to do the following when it triggers:
· send email notifications to the service administrator and co-administrators
· send email to additional emails that you specify.
· call a webhook
· start execution of an Azure runbook (only from the Azure portal)
The steps to Configure an alert from the Portal are documented here : /en-in/azure/monitoring-and-diagnostics/insights-alerts-portal
The only difference would be to include the Webhook URL in this alert that we have configured.
You can also edit an already existing alert and add the Web hook URL to it
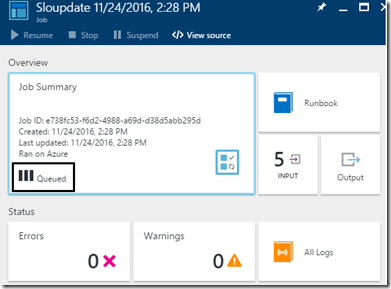
- You can check the status of the Runbook Job and will be able to see that it is Queued as we haven’t specified a schedule:
Step 4: Testing the configured Alert, Webhook and Runbook
Now let’s test a scenario to check if this works as expected
I run a test workload to increase the resource utilization of my database for which we have configured the DTU alert on
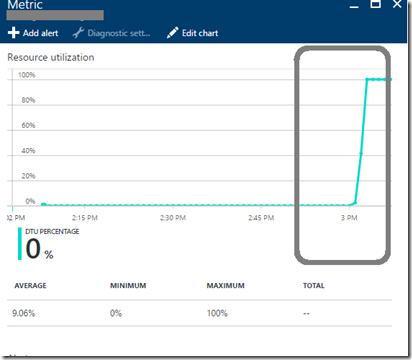
- Monitoring the alert I see that the DTU usage is steadily increasing, until it triggers the alert once the condition is met
(DTU threshold greater than 60% for the last 5 minutes)
- Now that the alert has triggered, it should have called the Webhook to start the execution of the Runbook.
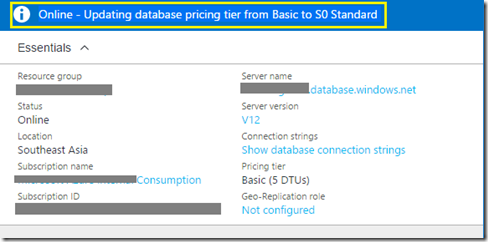
- Let’s check the Database blade in the Azure Portal to see if upgrade has indeed started
You can see that the SLO upgrade has automatically kicked in and it has already begun to upgrade the database from Basic to the S0 we had configured
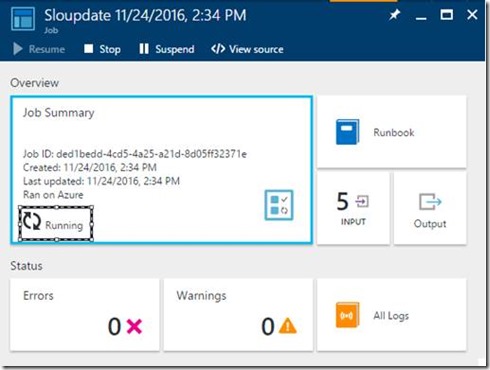
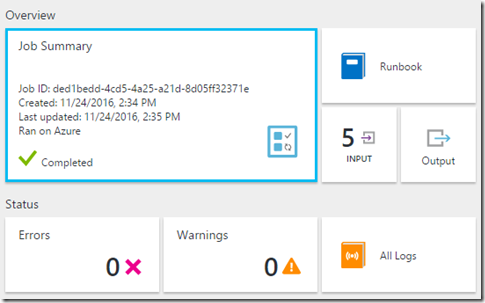
You can also check the Job status from the Runbook blade
- In the Azure portal, select Automation and then then click the name of your automation account.
- Select the Runbooks tab.
- Click your runbook to open its Runbook blade to check if it is running.
- Monitor it to completion
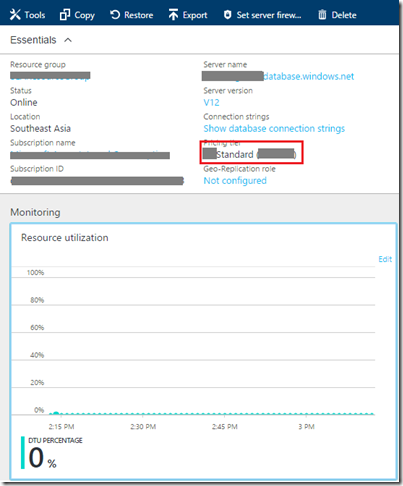
- You can see that the database is now in S0 Standard
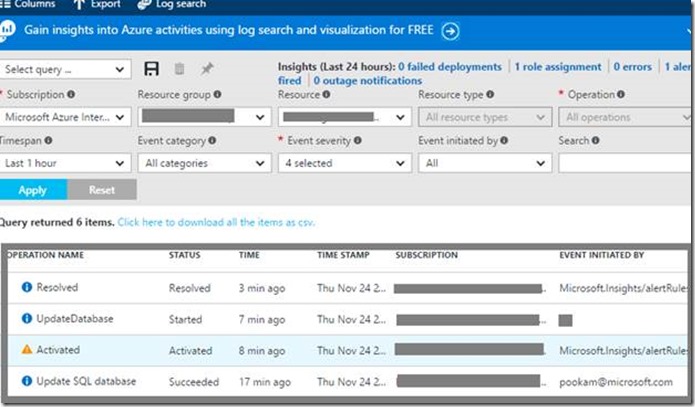
- If you want to keep a track of when you database was upgraded based on the Alert trigger you can check the Activity log from the Database blade in the Azure Portal.
In this example I have filtered this for activity from the last one hour only.
Now you do not have to worry about monitoring your Alert emails and then taking a reactive action of upgrading your database.
The Webhooks allows you to route the High DTU utilization Azure alert notification to use the Runbook with the configured Powershell script to take action when the condition is triggered even when you are fast asleep or vacationing away!
Hope this helps!
Comments
- Anonymous
December 24, 2016
wow great ! thanks for sharing it - Anonymous
January 04, 2017
This is good to know! Thanks for sharing.- Anonymous
October 03, 2017
The comment has been removed
- Anonymous
- Anonymous
February 07, 2017
Thanks Pooja for a nice clear article. One question I had for you. Once the database has scaled, what would be the easiest way to automate scaling the database back to the lower tier once the resource issue had been solved and the DTU was back at a low level?- Anonymous
October 03, 2017
If you do not want to alter the script ...the easier way would be to create an alert from the Portal the exact same way we did , but to fire when the DTU drops below your threshold level. You will have to attach the alert to a separate Webhook though. Use the webhook to call the script with the different parameters to downscale the database.
- Anonymous
- Anonymous
September 29, 2017
Very much like this, not sure about what server credentials to use. AzureSQL server admin?- Anonymous
October 03, 2017
Yes you will have to use the Azure SQL Server Admin
- Anonymous
- Anonymous
March 14, 2018
Nice article. One question is while automate scaling service tier at that time what happen with current operation or current connection ?Does it lost ? Any possibility of lost data ?- Anonymous
April 20, 2018
The database will stay online throughout the upgrade operation, with only a brief disconnect/reconnect occurring at the end in some cases. The inflight connections will be rolled back. There will be no data lost. The database connection string is unaltered and your applications don’t need to be changed or reconfigured. Most of these reconfiguration events finish in less than 60 seconds. To handle them, you can implement retry logic in the application code instead of surfacing them to users as application errors.Using retry logi: https://docs.microsoft.com/en-us/azure/sql-database/sql-database-connectivity-issues#retry-logic-for-transient-errors
- Anonymous
