How to integrate SSRS Reports with Dashboard Filters
PerformancePoint Monitoring Filters work with SSRS reports, both relational and OLAP. To configure a dashboard pages to use common filters to drive SSRS reports and other PerformancePoint views, follow the below steps.
For this example, we will configure a dashboard containing one page with one scorecard view (OLAP data source) and one SSRS Relational report and a second page containing the same OLAP scorecard and a second SSRS OLAP report. Note, the SSRS reports are both configured in SSRS to have an SSRS parameter based on Geography - the parameters must be set up in SSRS prior to connecting the parameter to a Filter in the PerformancePoint dashboard.
Create report views for your SSRS reports
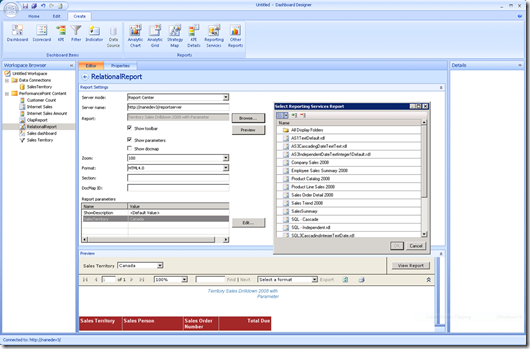
Right click the PerformancePoint Content list in the dashboard designer and select New->Report. From the dialog select Reporting Services and click OK. You can also create the report view by clicking on Reporting Services on the Create tab of the Ribbon .
Change the name of the created view and hit Enter.
Enter the Server URL to the SSRS report server. EX: https://servername/reportserver.
Click the Browse button and select the SSRS report you wish to include. Click OK.
Ensure that the parameters came through and are listed in the Report Parameters section.
Select each parameter, click Edit and set a default value.
Save the report to your PerformancePoint Server by selecting the Save button on the Quick Access Toolbar.
Repeat steps 1 through 8 for all your report views you wish to include. Note that the process does not differ for Relational vs. OLAP SSRS Reports.
Configure your dashboard
Click on Dashboard button on the Create tab of the Ribbon in the Dashboard Designer to create new dashboard.
Select your template (in this example, we will choose 3 Rows) and click OK.
Change the name of your dashboard in the Workspace Browser.
Drag your scorecard, in this example I choose an OLAP scorecard, and pull it into the Center Row.
Drag your SSRS report, in this example I pull an SSRS Relational Report, into the Bottom Row.
Create a Filter in the Dashboard. In this example, I build a filter off of my OLAP data source that sources my scorecard and is the same cube as my SSRS OLAP report is built from.
Drag your Filter into the Top Row.
Click on the Filter in the top row you will see a list of options listed under your parameter name as shown below:
Select Display Value and drag it to your SSRS Relational Report input area in the Bottom Row. Note, in order for this to work, your names in your SSRS Relational Report parameter, must match the captions of your members in the cube. Display Value specifies that we will provide the cube member name caption as the input to the report.
In the Connection dialog, select the SSRS Report parameter from the Connect to: drop down to create the link between the PerformancePoint filter and SSRS report parameter. Click OK.
Click on the filter again and select MemberUniqueName and drag it into the input area for the scorecard. We do this because our scorecard is built off of a cube data source and needs the MDX member unique names passed as inputs.
In the Connection dialog, select Page form the Connect to: drop down list to pass the parameter as a filter to the scorecard. Click OK.
Create a second page in your dashboard, also configured with 3 rows.
Place your same OLAP scorecard in the Center Row, your SSRS OLAP report in the Bottom Row and the same filter in the Top Row.
Click on the filter and drag the MemberUniqueName property to the input of the SSRS OLAP Report. In this case, we need the member unique name because the SSRS report is an MDX query which requires the MDX unique name as the parameter value.
In the Connection dialog, select the SSRS Report parameter from the Connect to: drop down to create the link between the PerformancePoint filter and SSRS report parameter. Click OK.
Click on the filter again and select MemberUniqueName and drag it into the input area for the scorecard.
In the Connection dialog, select Page form the Connect to: to pass the parameter as a filter to the scorecard. Click OK.
Publish your dashboard by selecting the Deploy from the File Button.
In the Deploy To dialog select the Document Library you wish to publish to, select the master page you wish to publish with and click OK.
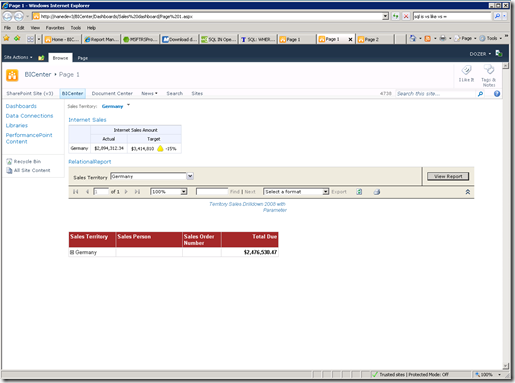
Your exported dashboard should look as follows:
Changing the parameter will result in changes to both the scorecard values and the SSRS Report as follows:
Go to page 2 and try the same with your OLAP SSRS report and scorecard - values in both views will change.
Comments
Anonymous
May 16, 2010
This functionality also works with a custom text search filter for PerformancePoint 2007 and SSRS 2005 / 2008. You can find out more at: "http://futuresults.spaces.live.com/blog/cns!C744D1F0A0609818!158.entry" You can also see the full text search capability, url parameterization, and configuration capabilites at: http://futuresults.com/PPS_Custom_Text_Filter.aspxAnonymous
November 11, 2010
when i am trying to access the report server from the PPS designer,this is showing error as "could not connect to the server,make sure the address is correct".when i m trying to open the report server through broswer it is opeing. again i have installed the PPS SP2 also kerboros is not runnin for that server.please suggest me.Anonymous
November 20, 2010
The comment has been removedAnonymous
November 20, 2010
I found the bug. I began selecting and unselecting options in Dashboard Designer. (If all else fails change things wildly until something works! Right?) Anyway, it turns out the “Show toolbar” checkbox breaks the report rendering (the Preview and in SharePoint). With that option unchecked, all is well! So, I guess as long as no one wants to see the toolbar life is good! Hope this helps others.Anonymous
November 21, 2010
Ok, so here’s the next issue. Our SharePoint 2010 environment is set up for Claims Based Authentication. All works well over our extended web application through Dashboard Designer and rendering through our extended SharePoint 2010 site. Side Note: We were forced to “Extend” our web application, which basically creates a backdoor through which we can access SharePoint 2010 using NTLM (Active Directory) and bypassing our Claims Based front end. This is the only way to get Dashboard Designer to play well with a Claims Based site. Anyway, the issue is the SSRS content doesn’t render for our claims users! I ran Fiddler2 which shows that the Dashboard containing the SSRS report is actually trying to render the report using the extended SharePoint 2010 URL and not a more generic version. This of course will not work for our Claims Based users. I attempted to trick Dashboard Designer by hooking everything up over the extended web app then changing both the URLs to the Claims Based version. No dice. I get the following error: “Unable to get filter values from "<<FilterName>>".You do not have permission to view this data.” I then attempted to change just the report server URL and leave the Report URL pointing to the Claims Based Instance. Again, Fiddler2 reveals that the rendering web part is calling back to the Extended URL, this means it’s using the Report Server URL at rendering time not just design time. Bummer. Is there any way to get a Performance Point Dashboard to display a Parameterized SSRS report over a Claims Based Authentication instance of SharePoint 2010? Any help would be greatly appreciated. Thanks in advance.Anonymous
June 02, 2011
Hi Stephen, did you get any workaround for parametrized SSRS reports in Performance Point Dashboard? Any feedback in this regard will be highly appreciated Thanks.Anonymous
October 09, 2011
The comment has been removed


