User Mode Versus Privileged Mode Processor Usage
You have arrived at this point in the adventure because you have identified high processor usage on your Windows computer. If this is not correct, then return to the Start of the Performance Guide.
Threads (the worker bees of a process) can execute in one of two modes: User Mode or Privileged Mode
This article will help you determine what kind of processor mode your computer or server is spending most of it’s time in. This is important because this is a major decision path in the adventure and change change the troubleshooting steps and the outcome dramatically.
“\Processor(_Total)\% Processor Time” is the sum of “\Processor(*)\% User Time” and “\Processor(*)\% Privileged Time”.
Privileged (Kernel) Mode
Privileged Time is the amount of time being spent in the Windows kernel executing system calls such as drivers, IRPs (I/O Request Packets), context switching, etc. If the operating system is spending more than 30% of it’s time in privileged mode, then it means that it is likely doing a high amount of I/O and one or more of the drivers are executing to manage that I/O.
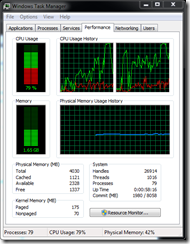
You can identify this by using Task Manager, clicking on the Performance tab, then go to View, Show Kernel Times or by using the “\Processor(*)\% Privileged Time” performance counter in Performance Monitor.
The following screenshot shows a high amount of privileged time processor usage.
If your computer or server is spending more than 30% of it’s time in privileged mode, then look at a % DPC Time, % Interrupt Time, and Context Switches/sec in performance monitor.
If “\Processor(*)\% DPC Time” is greater than 20%, or if “\Processor(*)\% Interrupt Time” is greater then 20%, then go here.
If both of the counters above show very low values (less than 20%), then it could also be caused by high amounts of context switches per second.
Here is a case study on how to solve high context switching due to high disk I/O.
The Case of the 2 Million Context Switches
With that said, high context switching can also be caused by a high number of ready threads on the system, so reducing the number of threads can help as well.
Here is a good article by Mark Russinovich on how to use the driver SDK tool, KernRate, to profile the kernel. KernRate only works on Windows XP/2003 computers.
Mark Russinovich’s The Case of the System Process CPU Spikes
User Mode
User Time is the amount of time the processor spends executing application code therefore we need to determine what processes are consuming the most time and the function calls they are executing the most.
You can identify this by using Task Manager, clicking on the Performance tab, then go to View, Show Kernel Times or by using the “\Processor(*)\% User Time” performance counter in Performance Monitor.
The following screenshot shows a high amount of user time processor usage.
If your computer or server is spending most of it’s time in user mode, then follow this link on how to troubleshoot this issue:
How To: Identify Functions causing a High User-mode CPU Bottleneck for Server Applications in a Production Environment
