Tips for troubleshooting Operations Management Suite onboarding
This article provides a series of steps, procedures and known troubleshooting hints for either Operations Manager attached mode or for Direct Agents. Some sections apply to both and some apply only to one type or the other (SCOM or DA).
If you none of these steps in this article work for you:
- Customers with Premier support can log support cases via Premier
- Customers with Azure support agreements can log support cases in the Azure portal
- send us an email scdata@microsoft.com and we would be more than happy to help get your issue resolved.
- Feedback forum for ideas and bugs https://aka.ms/opinsightsfeedback
- For general discussion/question and answers (not ideas and bug reports) use the MSDN Forum
- How do I do XYZ? Try our documentation
- Follow us on Twitter @msopsmgmt and feel free to engage, but be aware that many questions can’t be answered in 140 characters!
The article contains the following sections:
- SCOM REGISTATION – ERROR 2200 – Describes an error you might encounter when connecting an Operations Manager management group.
- SCOM REGISTATION – ERROR 3000 – Describes an error you might encounter when connecting an Operations Manager management group.
- IF YOU HAVE A PROXY SERVER: REGISTRATION / CONFIGURATION STEPS – Describes how to configure proxy servers (if present) to allow traffic to Operational Insights (OpInsights).
- VERIFYING THAT THINGS ARE WORKING POST REGISTATION – Troubleshooting steps both for SCOM and for Direct Agents, including how to check if data flow is occurring and what common errors to look for, as well as how to resolve them.
- OTHER KNOWN ISSUES AND WORKAROUNDS (SCOM) – Other miscellaneous issues related to OpInsights onboarding from SCOM.
- IIS LOG COLLECTION – Important things to know about collecting IIS Logs with OpInsights.
- SQL and AD ASSESSMENT – Important things to know about SQL and AD Assessment Intelligence Packs.
- MALWARE ASSESSMENT – Important things to know about Malware Assessment Intelligence Packs.
- DIRECT AGENT SPECIFIC INFORMATION – Important things to know about directly connected agents.
- WINDOWS AZURE DIAGNOSTICS INFORMATION – Important things to know about collecting logs from Azure storage accounts.
SCOM REGISTATION – ERROR 2200 You may encounter “Error 2200: Unable to register to the Advisor Service. Please contact the system administrator” while trying to connect an OpsMgr 2012 R2 Management Group to OMS. 
There are two reason why you may see this:
1. The OMS workspace has not been created prior to trying to onboard via SCOM. If that is the case, create an OMS workspace via Operational Insights first, then trying onboarding with the same account.
2. After the primary install, or after installing the latest update rollups, the necessary management packs have not been imported in your SCOM management group. In the SCOM console, navigate to the administration view and choose to import management packs. Navigate to %SystemDrive%\Program Files\System Center 2012 SP1\Operations Manager\Server\Management Packs for Update Rollups and import the Management Packs in this folder. Once complete, restart the console and try onboarding again.
SCOM REGISTATION – ERROR 3000 We have had a few customers run into the “Error 3000: Unable to register to the Advisor Service” while trying to connect their OpsMgr 2012 Management group to OMS: 
There are two reason why you may run into this:
1. The server clock is out of sync with the current time by more than 5 minutes. You can resolve this pretty easily by changing the clock time on your server to match the current time. Do this by opening a CMD prompt as an Administrator and running w32tm /resync. Note that even if your clock says it is synchronized (e.g. with your company’s time server), it might still be out of sync with the one of our servers in Microsoft Azure. Since the time window is only 5 minutes, this is not unusual. Verify that you are synchronizing with a reliable time server ON THE INTERNET. You can further troubleshoot this type of issue by enabling Verbose tracing on the Management Server/Console computer. For more information see the following:
942864 - How to use diagnostic tracing in System Center Operations Manager 2007 and in System Center Essentials (https://support.microsoft.com/en-us/kb/942864)
2.You have internal proxy servers or firewalls that are blocking communication to the Advisor Service endpoints. We provide detailed instructions for this second case below so read on for more details.
IF YOU HAVE A PROXY SERVER: REGISTRATION / CONFIGURATION STEPS
Depending on your proxy configuration, you might not be able to register at all. Also, even if you do manage to register, some communication from SCOM to the service will later fail and scenarios might not light up in the portal. The protocols and endpoints needed to allow management servers, the console and direct agents to communicate in order for OpInsights to work are listed below.
Step 1: Request exception for the service endpoints
The following domains and URLs need to be accessible through the firewall/proxy for the management server to access the Azure Operational Insights Web Services:
Management Server
| URL | Ports |
| service.systemcenteradvisor.comscadvisor.accesscontrol.windows.netscadvisorservice.accesscontrol.windows.net*.blob.core.windows.net/*data.systemcenteradvisor.comods.systemcenteradvisor.com*.ods.opinsights.azure.com*.systemcenteradvisor.com | Port 443Port 443Port 443Port 443Port 443Port 443Port 443Port 443 |
Large Volume scenarios / intelligence packs and OpsMgr agents
Note that with some intelligence packs (now called Solutions), given the large volume of data sent in those scenarios, the agents, even if reporting to OpsMgr and receiving configuration from the OpsMgr Management Group, will report data directly without queuing thru the management server to the cloud. A good example of this is the Security and Audit solution. The URL and port needed for this communication is as follows:
| URL | Ports |
| *.ods.opinsights.azure.com | Port 443 |
Note that the proxy setting specified in Step 2 below will be automatically propagated to OpsMgr agents.
Operations Manager console
The following domains and URLs need to be accessible through the firewall to view the Advisor Web portal and the OpsMgr console (to perform ‘registration’ to Azure Operational Insights).
| Resource | Ports |
| *.systemcenteradvisor.com*.live.com*.microsoft.com*.microsoftonline.com login.windows.net | Ports 80 and 443Ports 80 and 443Ports 80 and 443Ports 80 and 443Ports 80 and 443 |
Also ensure the Internet Explorer proxy is set correctly on the computer you are trying to login with. It is especially valuable to test connecting to a SSL enabled website (e.g. https://www.bing.com/). If the HTTPS connection doesn’t work from a browser, it probably also won’t work in the Operations Manager console and in the server modules that talk to the web services in the cloud.
Directly-connected Agents
Direct Agents do not us your credentials to connect to the workspace: you have to enter workspace ID and key. Those credentials are used for registration, and after the agent is registered a certificate is used. Direct Agents only need to connect to the following destinations
| URL | Ports |
| *.blob.core.windows.net/**.oms.opinsights.azure.com*.ods.opinsights.azure.comods.systemcenteradvisor.com | Port 443Port 443Port 443Port 443 |
Once you have completed registering your OpsMgr environment to the Advisor Service, you must follow Steps 2, 3 and 4 below to allow your Management Servers to send data to the Advisor Web Service.
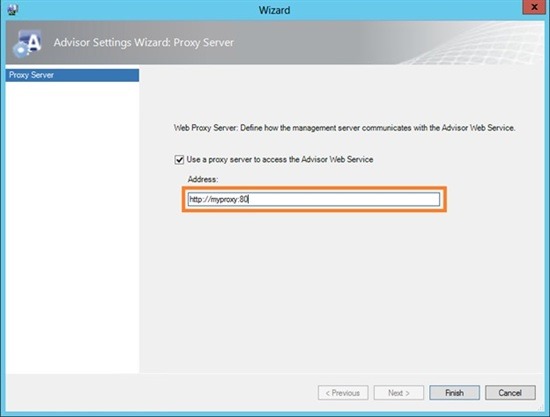
Step 2: Configure the proxy server in the OpsMgr console
- Open the OpsMgr Console.
- Go to the “Administration” view.
- Select “Advisor Connection” under the "System Center Advisor" node.
Click “Configure Proxy Server”: 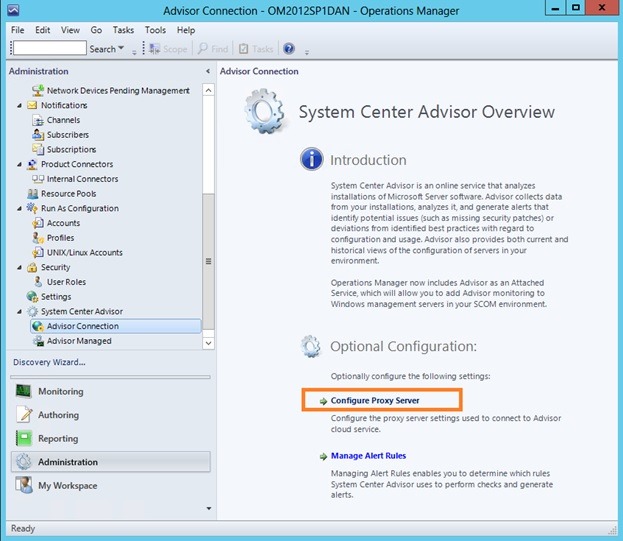
- Check the checkbox to use a proxy server to access the Advisor Web Service.
- Specify the proxy address in the https://proxyserver:port format.
Step 3: Specify credentials for OpsMgr if the proxy server requires authentication
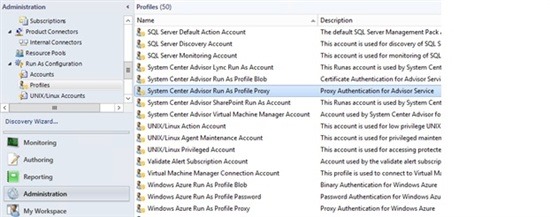
If your proxy server requires authentication, you can specify one in the form of an OpsMgr RunAs account and associate it with the ‘System Center Advisor Run As Profile Proxy’:
In the OpsMgr Console, go to the “Administration” view.
Select “Profiles” under the "RunAs Configuration" Node.
Double click and open “System Center Advisor Run As Profile Proxy”:
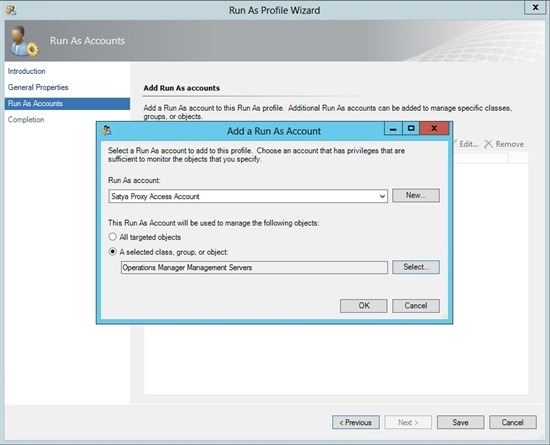
Click ‘Add’ to add a 'RunAs Account'. You can either create one or use an existing account. This account needs to have sufficient permissions to pass through the proxy.
- Set the Account to be targeted at the ‘Operations Manager Management Servers’ Group.
- Complete the wizard and save the changes:
Note: Not all code paths currently support authentication. It is still possible that you will need to set some of those exclusions mentioned in Step 1 to allow anonymous traffic to some of those destinations. We will keep this document up-to-date as this requirement evolves.
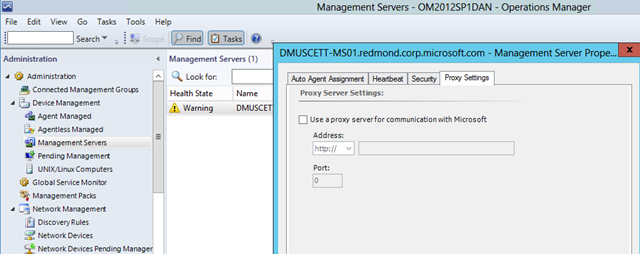
Step 4: Configure the proxy server on each OpsMgr Management Server for managed code
There is another setting in Operations Manager which is intended for general error reporting, but we have noticed that when this is set it also ends up affecting Advisor connector's functionality. This is because the same modules are being used in multiple workflows. The recommendation is therefore to also set it to the same proxy you set in the other places for each and every management server if you use a proxy.
- In the OpsMgr Console, go to the “Administration” view.
- Select “Device Management” and then the "Management Servers" node.
- Right-click and choose “Properties” for each MS (one at the time) and set the proxy in the “Proxy Settings” tab:
VERIFYING IF THINGS ARE WORKING POST REGISTRATION
Procedure 1: Validate that the right Management Packs get downloaded to your OpsMgr Environment
Note: Depending on which Solutions you have enabled from the Operational Insights portal, you may see more listed or less. Search for the keyword ‘Advisor’ or ‘Intelligence’ in their name. 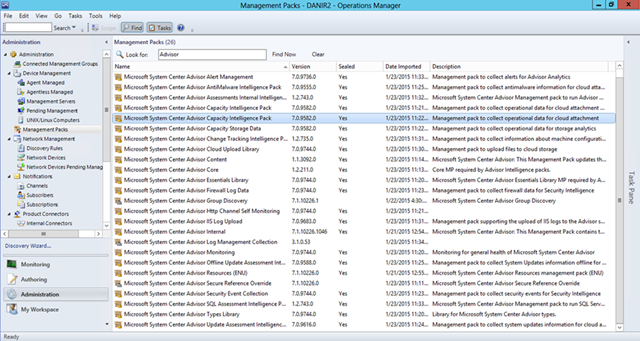
You can additionally check for these MPs using these PowerShell commands:
get-scommanagementpack | where {$_.DisplayName -match 'Advisor'} | select Name,DisplayName,Version,KeyToken
get-scommanagementpack | where {$_.DisplayName -match 'Advisor'} | select Name,DisplayName,Version,KeyToken | Out-GridView
Note: If you are troubleshooting Capacity, check HOW MANY management packs with the name containing ‘capacity’ you have. There are two management packs that have the same display name (but different internal ID’s) that come in the same MP bundle. If one of the two does not get imported (often due to a missing VMM dependency) the other MP does not get imported and the operation does not retry.
You should see the following three MPs related to ‘capacity’
- Microsoft System Center Advisor Capacity Intelligence Pack
- Microsoft System Center Advisor Capacity Intelligence Pack
- Microsoft System Center Advisor Capacity Storage Data
If you only see one or two of them but not all three, remove it and wait 5 to 10 minutes for OpsMgr to download and import them again. Check the event logs for errors during this time.
Procedure 2: Validate if the right Intelligence Packs get downloaded to your Direct Agent
In Direct Agent mode you should see the Intelligence Packs collection policy being cached under C:\Program Files\Microsoft Monitoring Agent\Agent\Health Service State\Management Packs 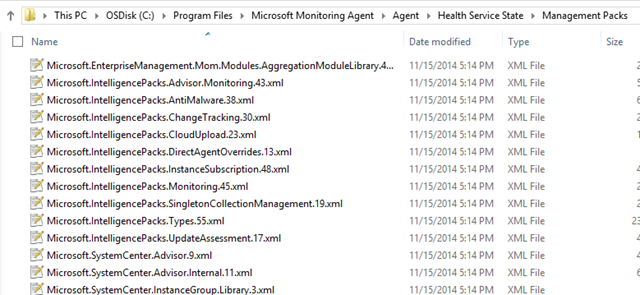
Procedure 3: Validate if data is being sent up to the Advisor service (or at last attempted)
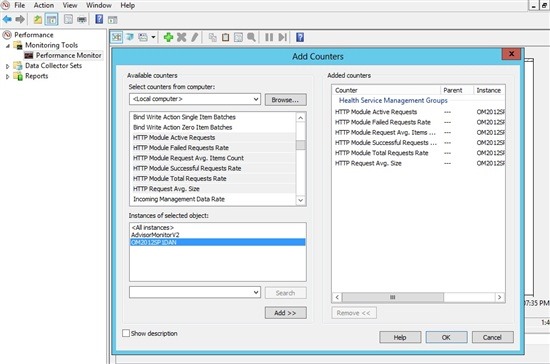
- Open ‘Performance Monitor’.
- Select ‘Health Service Management Groups’.
- Add all the counters that start with ‘HTTP’:
If things are configured correctly, you should see activity for these counters as events and other data items (based on the intelligence packs onboarded in the portal and the configured log collection policy) are uploaded. Those counters don’t necessarily have to be continuously ‘busy’, but if you see little to no activity it might be that you are not onboarded on many Solutions or have a very lightweight collection policy. 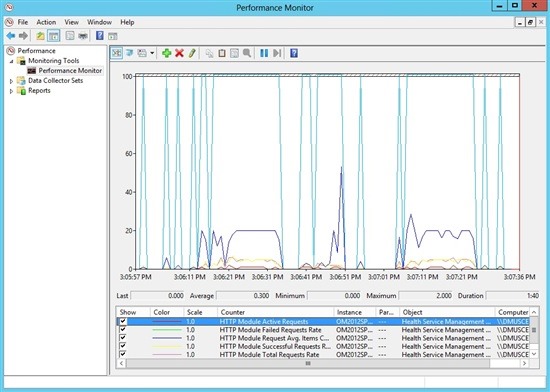
Procedure 4: Check for errors on the Management Server or Direct Agent event logs
As a final step, if all of the above fails see if you have any errors in Event Viewer –> Application and Services –> Operations Manager event log. Filter by Event Sources: Advisor, Health Service Modules, HealthService and Service Connector (this last one applies to Direct Agent only). You can copy these event and post them in the ‘Feedback’ forum so we on the product team can help you further. Most of these events would be also be found on Direct Agent and the troubleshooting steps would be similar. The only part that differs between SCOM and Direct Agent is really the registration process:
- In Operations Manager you have a nice wizard with browser integration that lets you pick your workspace as a user/admin, then SCOM takes care of exchanging certificates and uses those for MP download and data transfer/upload to OpInsights.
- In Direct Agent, you just copy/paste the workspace ID and key, and those are used to authenticate that it’s really you registering those agents and that you own that workspace, then certificates are exchanged under the hood by the service similarly to SCOM and used the same way.
Because of this, many of these events apply to both types of reporting infrastructure.
Open Event Viewer –> ‘Application and Services’ –> ‘Operations Manager’ and filter by Event Sources: Advisor, Health Service Modules, HealthService and Service Connector (this last one applies to Direct Agent only).
Here are a few of the ‘bad’ events you might see if things aren’t working the way they should:
| EventID | Source | Meaning | Resolution |
| 2138 | Health Service Modules | Proxy requires authentication | Follow step 3 and/or step 1 above |
| 2137 | Health Service Modules | Cannot read the authentication certificate | Re-running the Advisor registration wizard will fix certificates/runas accounts |
| 2132 | Health Service Modules | Not Authorized | Could be an issue with the certificate and/or registration to the service; try re-running the Advisor registration wizard that will fix certificates and runas accounts. Additionally, verify the proxy has been set to allow exclusions as in step 1 above, and/or verify authentication as in step 3 (and that the user indeed has access thru the proxy) |
| 2129 | Health Service Modules | Failed connection / Failed SSL negotiation | There could be some strange TCP settings on this server. Check this other blog post from the community for such as case https://jacobbenson.com/?p=511 |
| 2127 | Health Service Modules | Failure sending data received error code | If it only happens once in a while, this could be just a glitch. Keep an eye to understand how often it happens. If very often (every 10 minutes or so throughout the day), then it is an issue – check your network configuration, proxy settings described above, and re-run registration wizard. But if it only happens sporadically (i.e. a couple of times per day) then everything should be fine, as data will be queued and retransmitted.Some of the HTTP error codes have some special meanings, i.e.:- the FIRST time that a MMA direct agent or management server tries to send data to our service, it will get a 500 error with an inner 404 error code – 404 means not found; this indicates that the storage area we’ll use for this new workspace of yours isn’t quite ready yet – it is being provisioned. On next retry, this will however be ready and flow will start working (under normal conditions).A 403 might indicate a permission/credential issue, and so forth. There are more information on the 403 below in the Direct agent specific section of this post. |
| 2128 | Health Service Modules | DNS name resolution failed | You server can’t resolve our internet address it is supposed to send data to. This might be DNS resolver settings on your machine, incorrect proxy settings, or a (temporary) issue with DNS at your provider. Like the previous event, depending if it happens constantly or ‘once in a while’ it could be an issue – or not. |
| 2130 | Health Service Modules | Time out | Like the previous event, depending if it happens constantly or ‘once in a while’ it could be an issue – or not. |
| 4511 | HealthService | Cannot load module "System.PublishDataToEndPoint" – file not found | Initialization of a module of type "System.PublishDataToEndPoint" (CLSID "{D407D659-65E4-4476-BF40-924E56841465}") failed with error code The system cannot find the file specified. This error indicates you have old DLLs on your machine, that don’t contain the required modules. The fix is to update your Management Servers to the latest Update Rollup. |
| 4502 | HealthService | Module crashed | If you see this for workflows with names such as CollectInstanceSpace or CollectTypeSpace it might mean the server is having issues to send some data. Depending on how often it happens - constantly or ‘once in a while’ - it could be an issue or not. If it happens more that every hour it is definitely an issue. If only fails this operation once or twice per day, it will be fine an able to recover. Depending on how the module actually fails (description will have more details) this could be an on-premises issue – i.e. to collect to DB – or an issue sending to the cloud. Verify your network and proxy settings, and worst case try restarting the HealthService. |
| 4501 | HealthService | Module "System.PublishDataToEndPoint" crashed | A module of type "System.PublishDataToEndPoint" reported an error 87L which was running as part of rule "Microsoft.SystemCenter.CollectAlertChangeDataToCloud" running for instance "Operations Manager Management Group" with id:"{6B1D1BE8-EBB4-B425-08DC-2385C5930B04}" in management group "SCOMTEST".You should NOT see this with this exact workflow, module and error anymore, it used to be a bug *now fixed* tracked here https://feedback.azure.com/forums/267889-azure-operational-insights/suggestions/6714689-alert-management-intelligence-pack-not-sending-ale |
| 4002 | Service Connector | The service returned HTTP status code 403 in response to a query. Please check with the service administrator for the health of the service. The query will be retried later. | You can get a 403 during the agent’s initial registration phase, you’ll se a URL likehttps://<YourWorkspaceID>.oms.opinsights.azure.com/ AgentService.svc/AgentTopologyRequestError code 403 means ‘forbidden’ – this is typically a wrongly-copied WorkspaceId or key, or the clock is not synced (just like for ‘error 3000’ in SCOM at the beginning of this article) – see more here |
Procedure 5: Look for your agents to send their data and have it indexed in the portal
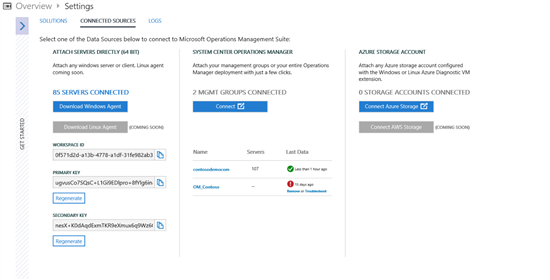
Check in the Operational Insights portal to see if your clients are reporting in. From the Overview page, navigate to the large blue SETTINGS tile - it will be either the first or last tile depending on your configuration state. In SETTINGS, click the CONNECTED SOURCES tab. Each column on this page represents a different data source type attached (servers attached directly, OpsMgr management groups and Azure storage accounts). Clicking the blue "X servers/mgmt groups/storage accounts connected" will bring you to a search with more detail. On this page you will also see a list of individual management groups connected. Clicking one of these management groups will also bring you to a search and show you a list of the servers connected to this management group.
NOTE: If a data source is listed as reporting on this page, it does not necessarily mean we have collected any data from the source. In this case it's possible that drilling into search from this page will show inconsistent results (e.g. you'll see a data source listed in CONNNECTED SOURCES, but it won't be in search). Once data collection has started, either from an IP or from log collection, the results in search will be consistent.
OTHER KNOWN ISSUES AND WORKAROUNDS (SCOM)
The 'Search' button in the 'Add a Computer/Group' dialogue is missing
We have had a couple of customers report that the Search button in the Computer Search dialog is invisible. We are investigating why this happens. A temporary workaround is click in the ‘Filter by (optional)’ edit box and press TAB to get to the invisible search button, and then activate it by hitting <Spacebar> or <Enter>. 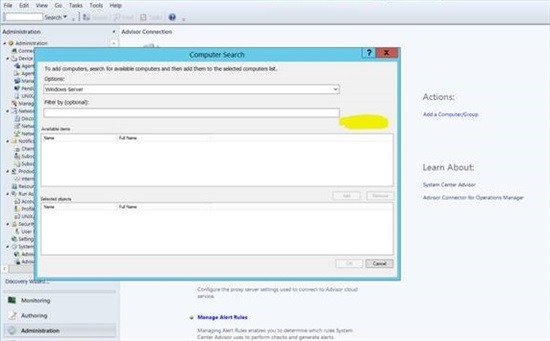
IIS LOG COLLECTION
There is another post here with specific information on how to best configure IIS logging for use with OpInsights and some other known issues:
IIS Log Format Requirements in Azure Operational Insights
Some info there also applies to Direct Agent but was mostly written for SCOM. There is other information about IIS with Direct Agent further down in this post.
SQL AND AD ASSESSMENT
SQL and AD Assessment requires .NET 4 on each agent that is to be assessed. Analysis runs on the SQL Server machines and on the Domain Controllers (for AD). SQL Assessment supports the Standard, Developer and Enterprise editions of SQL Server, all currently supported versions.
MALWARE ASSESSMENT
Windows 7 and Windows Server 2008 R2 have the issues described/tracked here:
See what Anti-Malware products are enabled by following this thread:
DIRECT AGENT SPECIFIC INFORMATION
Most of the errors in the table above under Procedure 4 regarding Management Servers also apply to Direct Agent. In Direct Agent, each agent is responsible to talk to OpInsights on its own, while in Operations Manager it is the Management Server that sends data on behalf of the agents reporting to it, acting as a gateway.
On Direct Agent, the most common issue we have seen so far is Error code 403 which means ‘forbidden’ – this is typically a wrongly copied workspace ID or key – see more here.
Other things that we are currently tracking for Direct Agent:
Capacity Management Intelligence Pack does NOT work with Direct Agent; only with Operations Manager. In fact it needs even Operations Manager to be integrated with System Center Virtual Machine Manager. We are tracking ideas to either generalize it starting here https://feedback.azure.com/forums/267889-azure-operational-insights/suggestions/6662146-open-up-the-capacity-management-pack-for-other-sys.
Alert Management Intelligence Pack does NOT work with Direct Agent; it depends on and requires Operations Manager whose alerts it synchronizes to the cloud.
Malware Assessment works, other than for the same symptom noted above for Windows Server 2008 R2 and Windows 7.
Update Assessment, Change Tracking as well as Log management Intelligence Packs for collecting Windows Events and IIS Logs works for both SCOM and Direct Agent already.
If you need documentation on how to install the agent (also in a scripted/unattended way) check the documentation here:
https://azure.microsoft.com/en-us/documentation/articles/operational-insights-direct-agent/
If needed, Direct Agent supports passing thru proxy and there is a PowerShell script in the documentation above that you can use to configure which proxy and credentials to use on the agent. Note that it’s an application-specific setting. No processes other than MMA’s need to be be able to know how to reach the internet.
If your VM is in Azure you can one-click install/enable the agent from the Azure portal:
We currently only have a 64-bit version of the agent. 32-bit is tracked here:
WINDOWS AZURE DIAGNOSTICS INFORMATION
Log management thru Azure Portal integration allows you to also ingest Windows events from Windows Azure Diagnostics (WAD) storage. This works for Cloud Services roles and IaaS VMs configured to write to WAD.
Collecting IIS Logs from WAD works for Cloud Services and for IaaS VMs but not currently for Azure Web Sites. This is tracked here:
Check out and vote the other ideas about what to collect in this category on our forum here:
Lastly, there is a good paper on how to configure your Microsoft Azure roles and virtual machines to write to Windows Azure Diagnostics storage in the first place here:
Satya, Daniele and other folks on the OpInsights team maintain and update this post regularly with new information and learning; check it regularly!
J.C. Hornbeck | Solution Asset PM | Microsoft 

Our Blogs
- Configuration Manager: https://blogs.technet.com/configurationmgr/
- Data Protection Manager: https://blogs.technet.com/dpm/
- Orchestrator: https://blogs.technet.com/b/orchestrator/
- Operations Manager: https://blogs.technet.com/momteam/
- Operations Management Suite: https://blogs.technet.microsoft.com/omsblog/
- Service Manager: https://blogs.technet.com/b/servicemanager
- Virtual Machine Manager: https://blogs.technet.com/scvmm
- Microsoft Intune: https://blogs.technet.microsoft.com/intunesupport/
- WSUS: https://blogs.technet.com/sus/
- AD and Azure RMS: https://blogs.technet.com/b/rms/
- Application Virtualization: https://blogs.technet.com/appv/
- MED-V: https://blogs.technet.com/medv/
- Application Proxy: https://blogs.technet.com/b/applicationproxyblog/
- Forefront Endpoint Protection: https://blogs.technet.com/b/clientsecurity/
- Forefront Identity Manager: https://blogs.msdn.com/b/ms-identity-support/
- Forefront TMG: https://blogs.technet.com/b/isablog/
- Forefront UAG: https://blogs.technet.com/b/edgeaccessblog/
