Predicting NYC Taxi Tips using MicrosoftML
MicrosoftML is a new package for Microsoft R Server that adds state-of-the-art algorithms and data transforms to Microsoft R Server functionality. MicrosoftML includes these algorithms:
- Fast linear learner, with support for L1 and L2 regularization.
- Fast boosted decision tree.
- Fast random forest.
- Logistic regression, with support for L1 and L2 regularization.
- GPU-accelerated Deep Neural Networks (DNNs) with convolutions.
- Binary classification using a One-Class Support Vector Machine.
The MicrosoftML package is currently available in Microsoft R Server for Windows and in the SQL Server vNext.
In this article, we will walk through a simple prediction task (Binary classification) using NYC Taxi dataset : Predict whether or not a tip was paid for a trip, i.e. a tip_amount that is greater than $0 is a positive example, while a tip_amount of $0 is a negative example. We will be using the different algorithms available in the Microsoft ML Package to fit the model and also find the best fit model using AUC (Area Under ROC Curve). The Azure Data Science Virtual Machine is very helpful for running this prediction task, since it comes pre-installed with our requirements : SQL Server 2016 SP1 Developer edition with R Services, MicrosoftML Package, Jupyter Notebooks, NYC Taxi dataset pre-loaded in SQL Server database called nyctaxi.
Once you provision a Data Science VM in Azure, remote desktop into the machine and open SQL Server Management Studio (there will be a desktop shortcut) and connect to the local SQL Server Instance. Expand Databases to view the nyctaxi DB. We will be using [dbo].[nyctaxi_sample] table as dataset.
We shall use Jupyter Notebooks to run R code. In Data Science VM, you can configure Jupyter Notebooks using the Desktop Shortcut JupyterSetPasswordAndStart.cmd. Once configured, just open browser and hit https://localhost:9999. Create a new Notebook with R (say MicrosoftML_NYC_Taxi_Tip_Prediction.ipynb) :
NOTE : You can use any environment to run the R code in this article – Jupyter Notebooks, RStudio Desktop, R Tools for Visual Studio, SQL Server Management Studio (using sp_execute_external_script).
There are 8 steps in this experiment :
Step 1: Load the MicrosoftML package
Step 2: Import Data
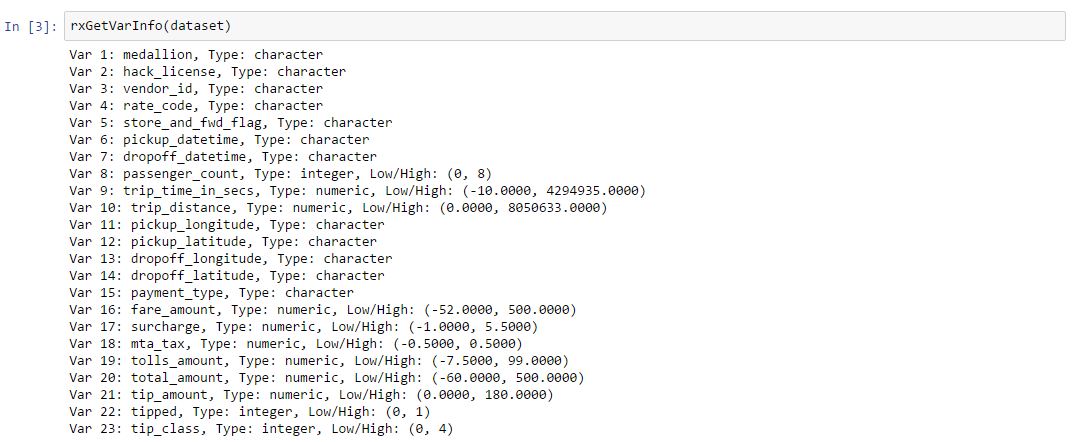
Load the table [dbo].[nyctaxi_sample] from nyctaxi DB into a data frame in R. rxGetVarInfo() function provides some details about the columns. The column “tipped” has values 0 (tip_amount = 0) and 1(tip_amount > 0).
Step 3: Split Dataset into Train and Test
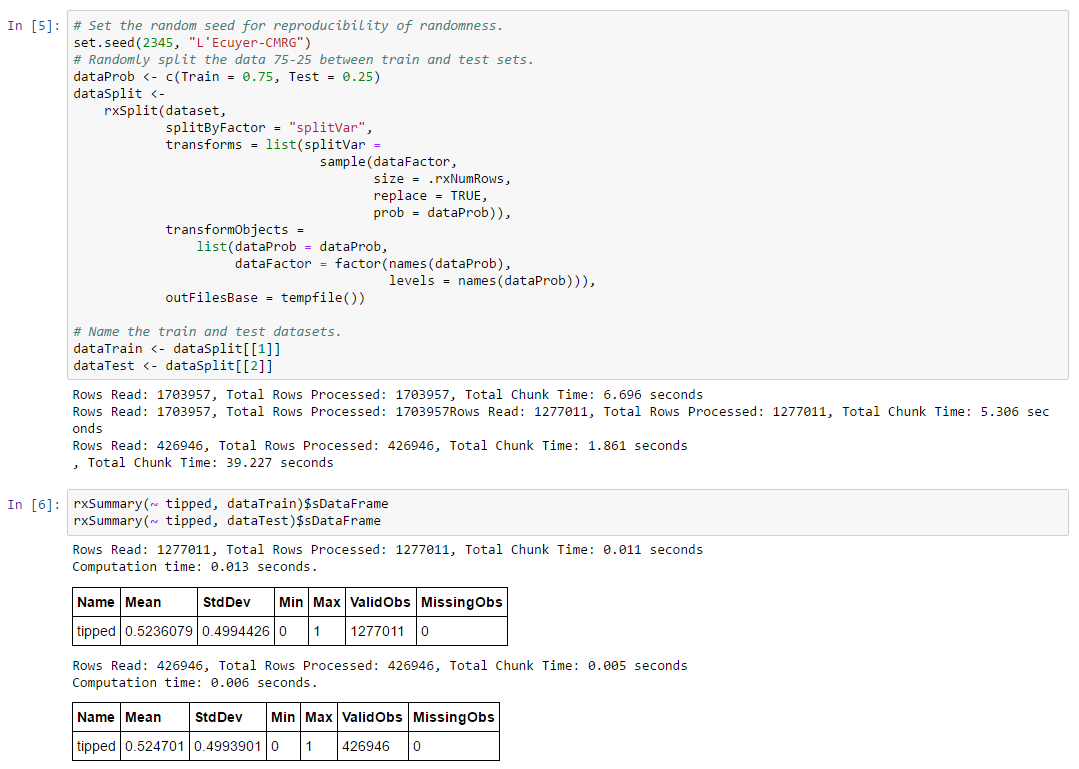
Split the loaded NYC Taxi Dataset into Train(75%) and Test(25%). Training data is used to develop the model and Test data will be scored using the developed model. Use rxSummary() to get a summary view of the Train and Test Data.
Step 4: Define Model
The model is a formula that says that value of “tipped” is to be identified using Features like passenger_count, trip_time_in_secs, trip_distance, total_amount. We are just using the four numerical columns available in the dataset as features. There are better ways to perform feature selection.
Step 5: Fit Model
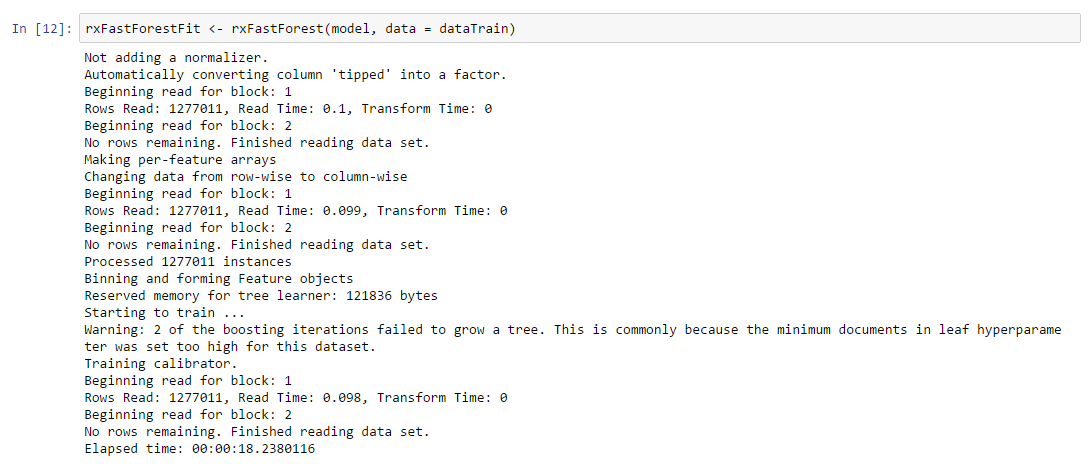
We will use the following five algorithms/functions from MicrosoftML package, which support Binary Classification Task, to fit the model:
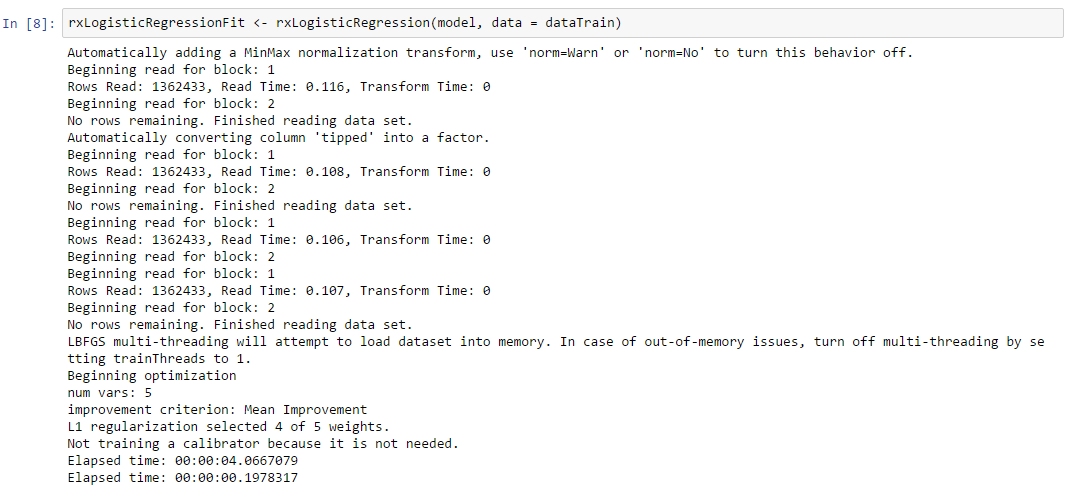
Logistic regression: The rxLogisticRegression() algorithm is used to predict the value of a categorical dependent variable from its relationship to one or more independent variables assumed to have a logistic distribution. The rxLogisticRegression learner automatically adjusts the weights to select those variables that are most useful for making predictions (L1 and L2 regularization).
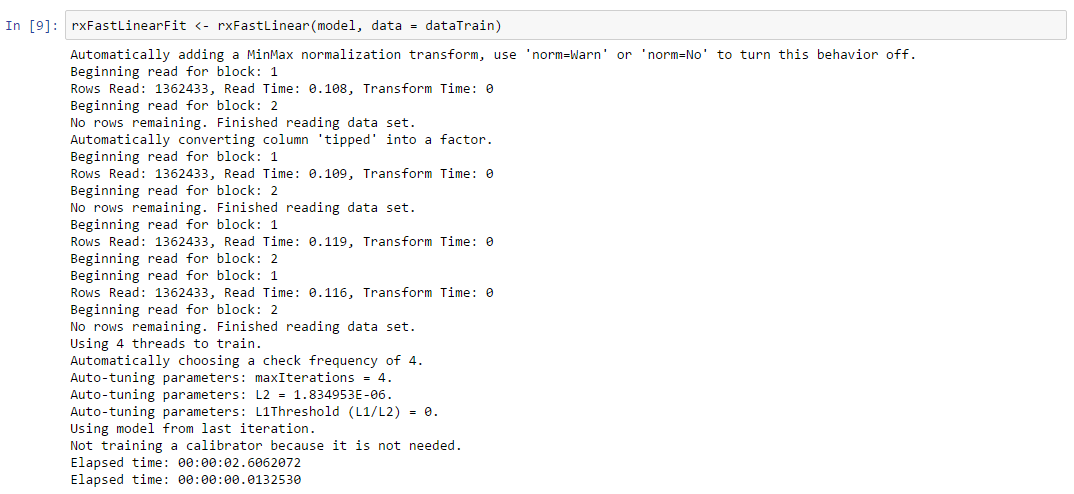
Fast Linear model (SDCA): The rxFastLinear() algorithm is based on the Stochastic Dual Coordinate Ascent (SDCA) method, a state-of-the-art optimization technique for convex objective functions. The algorithm can be scaled for use on large out-of-memory data sets due to a semi-asynchronized implementation that supports multithreaded processing. Several choices of loss functions are also provided and elastic net regularization is supported. The SDCA method combines several of the best properties and capabilities of logistic regression and SVM algorithms.
Fast Tree: The rxFastTrees() algorithm is a high performing, state of the art scalable boosted decision tree that implements FastRank, an efficient implementation of the MART gradient boosting algorithm. MART learns an ensemble of regression trees, which is a decision tree with scalar values in its leaves. For binary classification, the output is converted to a probability by using some form of calibration.
Fast Forest: The rxFastForest() algorithm is a random forest that provides a learning method for classification that constructs an ensemble of decision trees at training time, outputting the class that is the mode of the classes of the individual trees. Random decision forests can correct for the overfitting to training data sets to which decision trees are prone. The rxFastForest learner automatically builds a set of trees whose combined predictions are better than the predictions of any one of the trees.
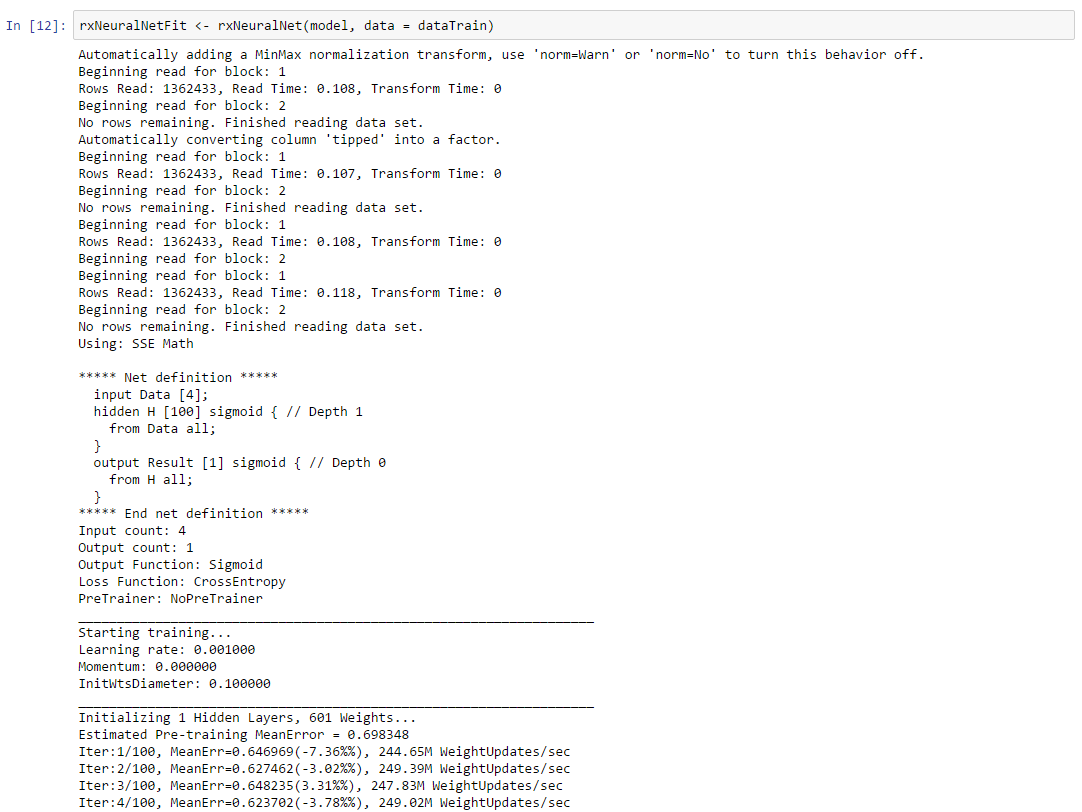
Neural Network: The rxNeuralNet() algorithm supports a user-defined multilayer network topology with GPU acceleration. A neural network is a class of prediction models inspired by the human brain. It can be represented as a weighted directed graph. Each node in the graph is called a neuron. The neural network algorithm tries to learn the optimal weights on the edges based on the training data. Any class of statistical models can be considered a neural network if they use adaptive weights and can approximate non-linear functions of their inputs. Neural network regression is especially suited to problems where a more traditional regression model cannot fit a solution.
(it runs for 100 iterations, cropping image to save space)
Step 6: Predict
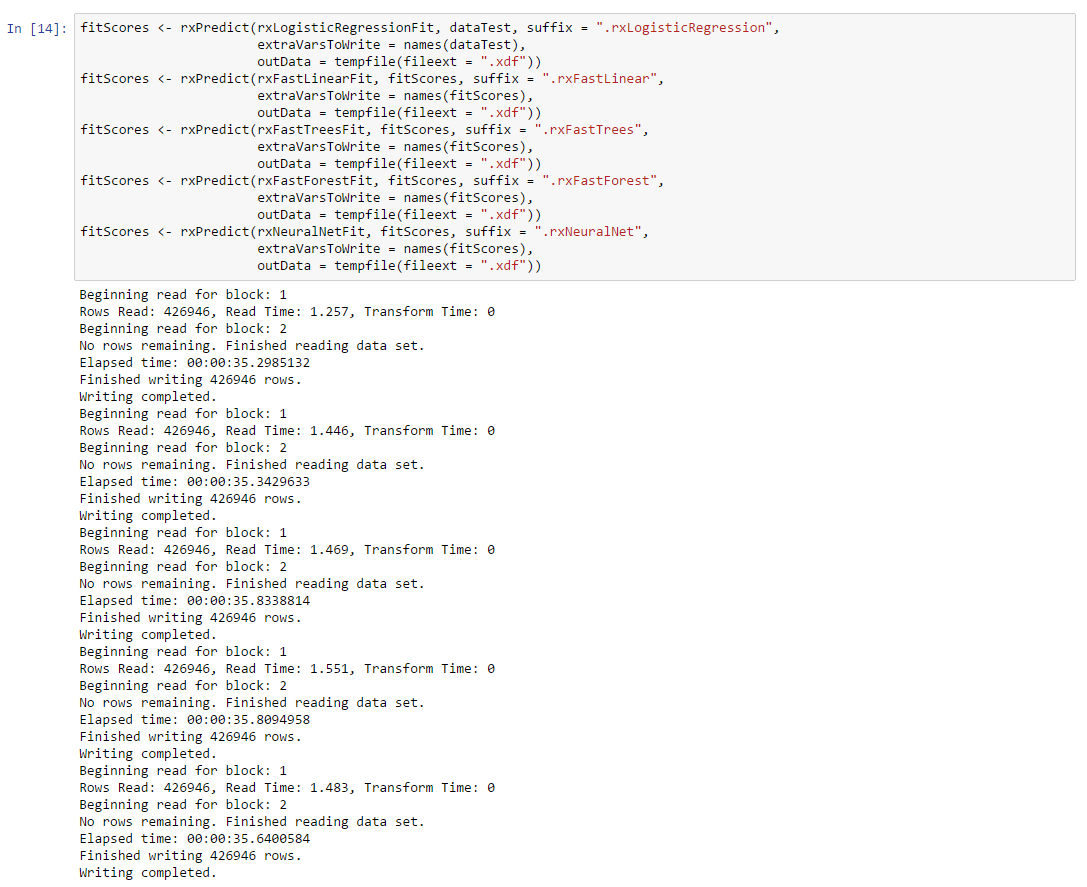
Using rxPredict() function, we will score the Test Data using the models created in previous step. The predictions are put into one table for side-by-side plotting and comparison.
Step 7: Compare Models
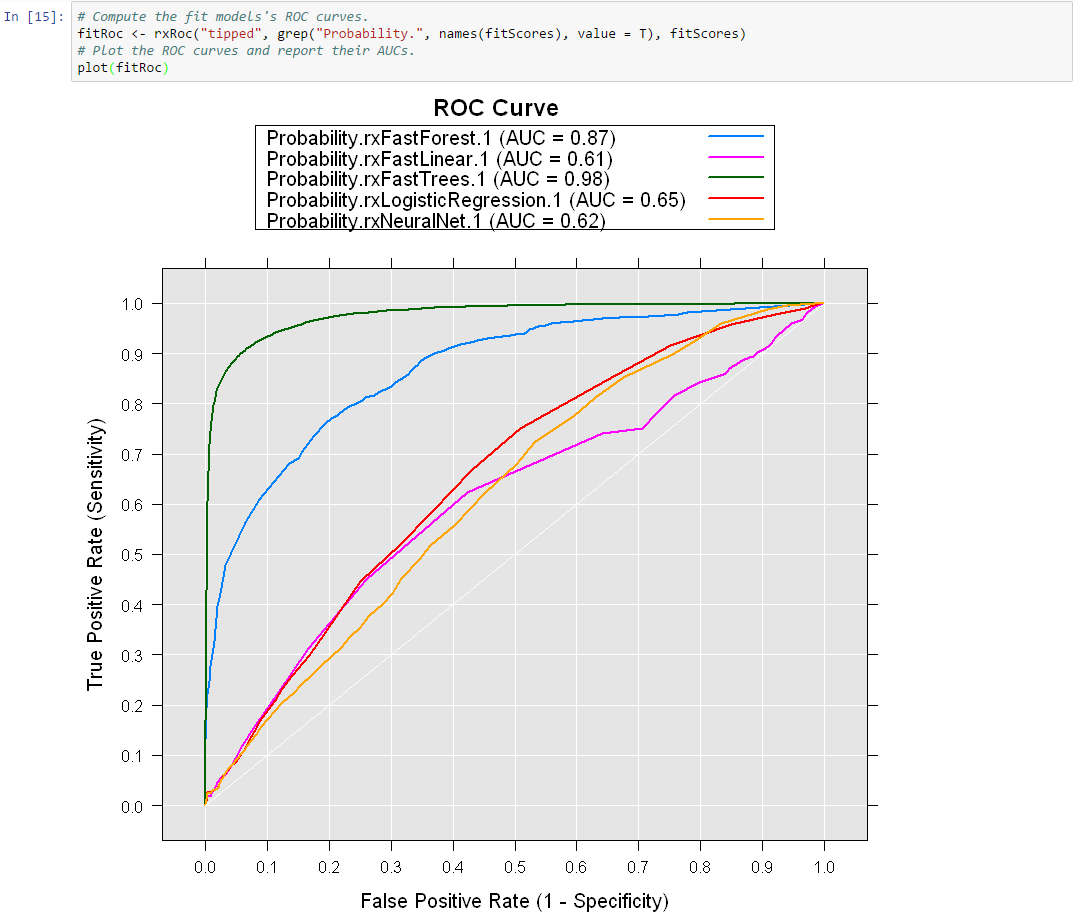
Compare Models by plotting ROC Curves and calculating AUCs.
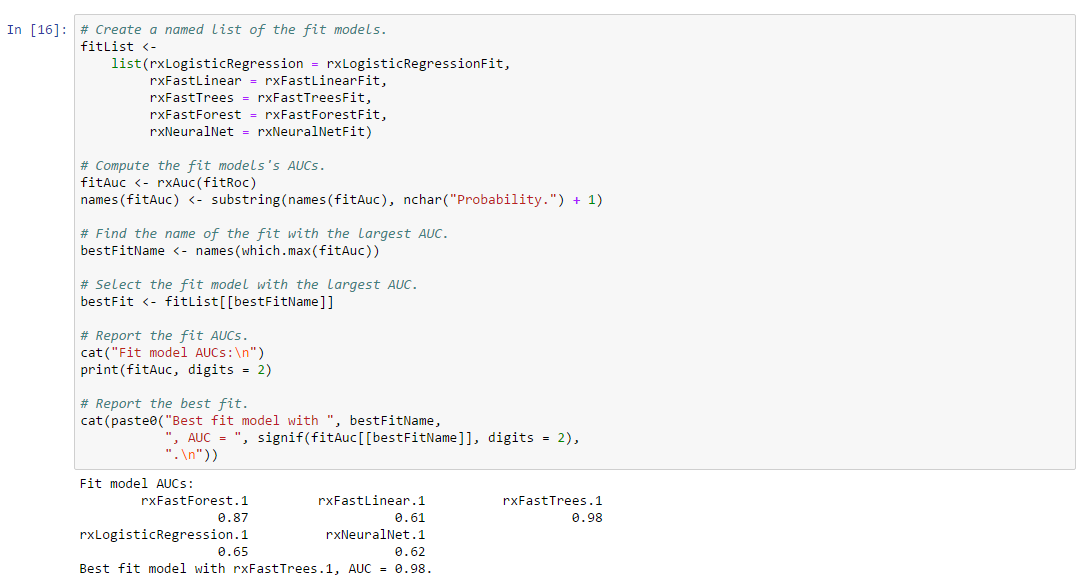
Step 8: Find the best fit using AUC values
The Best Fit model is found to be rxFastTrees with AUC = 0.98
Here is the complete R code, if you wish to run it in RStudio Desktop or R Tools for Visual Studio :
You can also run it in SQL Server Management Studio using sp_execute_external_script, here is a sample :
REFERENCES
MicrosoftML: Machine Learning for Microsoft R!
Introducing Microsoft R Server 9.0
MicrosoftML algorithm cheat sheet
NYC Taxi Data The Area Under a ROC Curve
Recent Updates to the Microsoft Data Science Virtual Machine
Ten things you can do on the Data science Virtual Machine
The Team Data Science Process in action: using SQL Server
Comments
- Anonymous
January 18, 2017
I'm a little confused about why this can't be done in SQL 2016. If it has R support then isn't MicrosoftML just a module, and can't it just be dumped in the R library folder and work?For those of us wanting to learn R on current production grade software it's a bit disheartening to want to try stuff only to read it's not going to work until a few years from now for reasons unspecified...- Anonymous
January 18, 2017
Hi Cody, You can also use MicrosoftML functions inside SQL 2016 using sp_execute_external_script stored procedure. I have included a small sample at the end of the article.- Anonymous
March 06, 2017
Hi Cody, Here are some steps to install MicrosoftML package for SQL 2016 : 1. Update SQL2016 to the latest version of service pack/update2. Install Microsoft R Server 9.0.1 for Windows (https://msdn.microsoft.com/microsoft-r/rserver-install-windows#howtoinstall)3. Run the SQLBindR.exe to update 2016’s version of R Server to 9.0.1 and R to 3.3.2 (https://msdn.microsoft.com/en-us/library/mt791781.aspx)
- Anonymous
- Anonymous
- Anonymous
January 21, 2017
No mater what I do, I can't get the GPU part of the MicrosoftML package to work in R..according to documentation you should use cuda v. 6.5 and cudnn v2.Anywone know if the package is cuda version dependent?- Anonymous
January 21, 2017
MicrosoftML only works with the 6.5 version. Use the "acceleration" parameter in rxNeuralNet() : acceleration : Specifies the type of hardware acceleration to use. Possible values are "sse" and "gpu". For GPU acceleration, it is recommended to use a miniBatchSize greater than one. If you want to use the GPU acceleration, there are additional manual setup steps are required: • Download and install NVidia CUDA Toolkit 6.5 : https://developer.nvidia.com/cuda-toolkit-65• Download and install NVidia cuDNN v2 Library : https://developer.nvidia.com/rdp/cudnn-archive• Find the libs directory of the MicrosoftML package by calling system.file("mxLibs/x64", package = "MicrosoftML"). • Copy cublas64_65.dll, cudart64_65.dll and cusparse64_65.dll from the CUDA Toolkit 6.5 into the libs directory of the MicrosoftML package. • Copy cudnn64_65.dll from the cuDNN v2 Library into the libs directory of the MicrosoftML package.- Anonymous
February 15, 2017
Thanks Ramkumar, downgrading to v6.5 worked.
- Anonymous
- Anonymous
- Anonymous
February 27, 2017
Hi there Ramkumar, how do you do?I downloaded the data from the link you made availible, and I got a 7z file, with the csv files inside. I'd like to know which variables you used as kyes to merge the trip_date dataset with the trip_fare. I will load the 24 files, 12 from trip_data and more 12 from trip_fare, and merge them.- Anonymous
February 27, 2017
Use [medallion] ,[hack_license] ,[vendor_id] as keys to merge the trip_data dataset with the trip_fare
- Anonymous
- Anonymous
March 06, 2017
What if there would be no "tipped" in test data and we have to predict it? Is there any way to use this package?- Anonymous
March 06, 2017
Hi Roman, If the test data does not have a column named "tipped", then rxPredict would throw the following exception : "Source column 'tipped' is required but not found".To avoid this exception, try adding an empty column "tipped" to test data like this : test$tipped <- 0- Anonymous
March 06, 2017
I've already tried this, and i got an error: Error: *** Exception: 'Could not apply a map over type 'I4' to column '59a50dfb33eb407c909b019baf27b888' since it has type 'R8''- Anonymous
March 06, 2017
Hi Roman, Using test$tipped <- 0 assigns tipped column type to be numeric , but the tipped column is of integer type in train data. Hence, please try this : test$tipped <- as.integer(0)- Anonymous
March 06, 2017
Thanks a lot. That worked well.
- Anonymous
- Anonymous
- Anonymous
- Anonymous


