The Case of the Slow Project File Opens
If you’ve seen one of my Case of the Unexplained presentations (like the one I delivered at TechEd Europe last month that’s posted for on-demand viewing), you know that I emphasize how thread stacks are a powerful troubleshooting tool for diagnosing the root cause of performance problems, buggy behavior, crashes and hangs (I provide a brief explanation of what a stack is in the TechEd presentation). That’s because often times the explanation for a process’s behavior lies in the code it loads, either explicitly like in the case of DLLs it depends on, or implicitly like for processes that host extensions. This case is another demonstration of successful stack troubleshooting. It also shows how a little time troubleshooting to get a couple of clues can quickly lead to a solution.
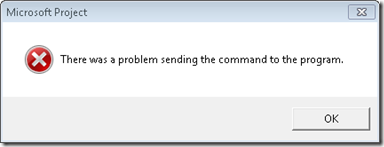
The case opened when the customer, a network administrator, contacted Microsoft support because a user reported that Microsoft Project files located on a network share were taking up to a minute to open and about 1 in 10 times the open resulted in an error:
The administrator verified the issue, checked networking settings and latency to the file server, but could not find anything that would explain the problem. The Microsoft support engineer assigned to the case asked the administrator to capture a Process Monitor and Network Monitor traces of a slow file open. After receiving the log a short time later, he opened the log and set a filter to include only operations issued by the Project process and then another filter to include paths that referenced the target file share, \\DBG.ADS.COM\LON-USERS-U. The File Summary dialog, which he opened from Process Monitor’s Tools menu, showed significant time spent in file operations accessing files on the share, shown in the File Time column:
The paths in the trace revealed that the user profiles were stored on the file server and that the launch of Project caused heavy access of the profile’s AppData subdirectory. If many users had their profiles stored on the same server via folder redirection and were running similar applications that used stored data in AppData, that would surely account for at least some of the delays the user was experiencing. It’s well known that redirecting the AppData directory can result in performance problems, so based on this, the support engineer arrived at his first recommendation: for the company to configure their roaming user profiles to not redirect AppData and to sync the AppData directory only at logon and logoff as per the guidance found in this Microsoft blog post:
Special considerations for AppData\Roaming folder:
If the AppData folder is redirected, some applications may experience performance issues because they will be accessing this folder over the network. If that is the case, it is recommended that you configure the following Group Policy setting to sync the AppData\Roaming folder only at logon and logoff and use the local cache while the user is logged on. While this may have an impact on logon/logoff speeds, the user experience may be better since applications will not freeze due to network latency.User configuration>Administrative Templates>System>User Profiles>Network directories to sync at Logon/Logoff.
If applications continue to experience issues, you should consider excluding AppData from Folder Redirection – the downside of doing so is that it may increase your logon/logoff time.
Next, the engineer examined the trace to see if Project was responsible for all the traffic to files like Global.MPT, or if an add-in was responsible. This is where the stack trace was indispensible. After setting a filter to show just accesses to Global.MPT, the file that accounted for most of the I/O time as shown by the summary dialog, he noticed that it was opened and read multiple times. First, he saw 5 or 6 long runs of small random reads:
The stacks for these operations showed that Project itself was responsible, however:
He also saw sequences of large, non-cached reads. The small reads he looked at first were cached, so there would be no network access after the first read caused the data to cache locally, but non-cached reads would go to the server every time, making them much more likely to impact performance:
To make matters worse, he saw this sequence six times in the trace, which you can see with a filter set to just show the initial read of each sequence:
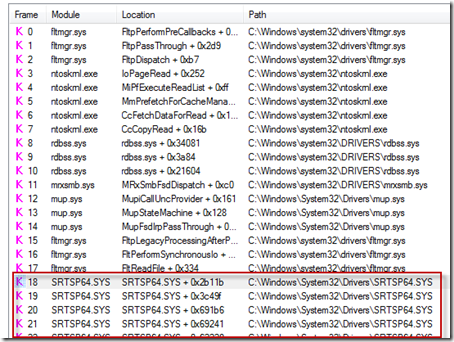
The stacks for these reads revealed them to be the result of a third-party driver, which was visible by the fact that the stack trace dialog, which he’d configured to obtain symbols from Microsoft’s public symbol servers, showed no symbol information:
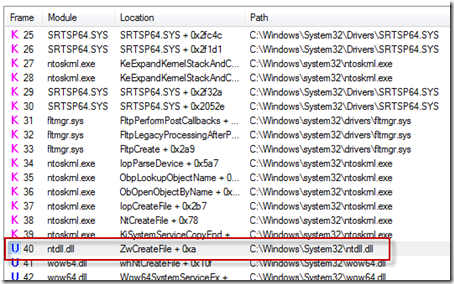
Further, the stack frames higher up the same stack showed that the sequence of reads were being performed within the context of Project opening the file, which is a behavior common to on-access virus scanners:
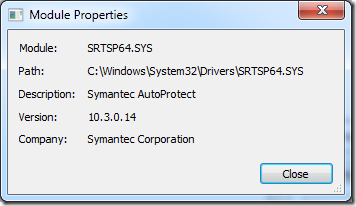
Sure enough, double-clicking on one of the SRTSP64.SYS lines in the stack dialog confirmed that it was Symantec AutoProtect that was repeatedly performing on-access virus detection each time Project opened the file with certain parameters:
Typically, administrators configure antivirus on file servers, so there’s no need for clients to scan files they reference on servers since client-side scanning simply results in duplicative scans. This lead to the support engineer’s second recommendation, which was for the administrator to set an exclusion filter on their client antivirus deployment for the file share hosting user profiles.
In less than fifteen minutes the engineer had written up his analysis and recommendations and sent them back to the customer. The network monitor trace merely served as confirmation of what he observed in the Process Monitor trace. The administrator proceeded to implement the suggestions and a few days later confirmed that the user was no longer experiencing long file loads or the errors they had reported. Another case closed with Process Monitor and thread stacks.
Comments
Anonymous
January 01, 2003
Hey really cool article! This is really the first insight of any kind that I've ever had in to what in the world all the programs and features based on 'stacks', 'traces', and 'dumps' are actually used for. Love this read though because not only did I get a hint of who uses that stuff, and how they make it useful for them, but...it just makes it all that much better how it reads as a sort of walk-through of a real world scenario. Also the way it's written up worked real well for me, i think i actually read every word; nothing too drawn out, key points quickly summarized, and of course pretty pictures! It felt like maybe it was written for somebody that's already indulged in these tools, but as someone that (although technologically adept) could only imagine how all of these terms being thrown around ('trace','stack','dump') were supposed to be useful to anybody but Bill Gates...It read very well! It feels like I just experienced the workflow behind these mysterious terms that pop up from time to time during a normal user's computing experience...Previously I had imagined data like this only being utilized by devs of the particular software in question, setting BPs in Softice or something...idk, guess I'm a noob, but I'm super curious now to see if I can learn to have this stuff make even more sense to me! Tomorrow perhaps since it's 5:45am right now and I should rest my brain before trying to teach it more stuff lol...anyways, nice article! Thank you for the read :pAnonymous
January 01, 2003
The comment has been removedAnonymous
January 01, 2003
I love the 'Case Of' post - keep them coming!Anonymous
January 01, 2003
Another case with Symantec product involved. This should be called the Case of Unexplained Symantec Programming :))Anonymous
January 01, 2003
@Dennis: The FltReadFile call at frame 17 is what triggers the read being performed. If you didn't know that API, the name of the routines on the stack indicate a read option (e.g. CcCopyRead, IoPageRead, etc). For some reason the RDBSS symbols aren't resolved in that screen grab, which would provide further clues (e.g. rdbss!RxCommonRead). The ZwCreateFile call at frame 40 just indicates that the reads are being sent from within the context of a create operaion. In other words, while processing the create operation issued by ZwCreateFile the file system filter driver (SRTSP) called FltReadFile to read from the file on disk. -scott -- http://www.analyze-v.comAnonymous
December 07, 2010
That's a fantabulous article. esp the non-cached reads part of it. Awesome work.Anonymous
December 07, 2010
Fabulous post as usual - keep on publishing the 'Case Of'!!!Anonymous
December 07, 2010
Thank You, this kind of stuff are greatAnonymous
December 08, 2010
The comment has been removedAnonymous
December 08, 2010
I do love these "The Case of..." posts. They've helped me diagnose problems in the past!Anonymous
December 08, 2010
Can you do the "Case Of" slow Windows XP PC during specific times. Like walking through the process of determining what is causing a PC to be slow... Your "Case Of" post are excellent.Anonymous
December 08, 2010
This is a great explanation of such a simple problem. Sometimes getting deep into the innards is exactly what is needed to figure out the culprit. Thanks for sharing!Anonymous
December 08, 2010
Come back from the cloud, Mark. We all just deployed windows 7 and we need you!Anonymous
December 08, 2010
I'll be trying to use Process Monitor to find the root cause of severe performance problems with one node of an Exchange 2007 CCR mailbox cluster so having case studies such as this is invaluable.Anonymous
December 08, 2010
Wonderful. Using procmon I've found that Symantec was slowing down copying files from windows share. Where it would copy 1000 files for 3 minutes originally, later that wen to 10 seconds. As the files did not have extensions, there was no way to change Symantec to not check them (the IT guy told me, it's based on extension filtering). We renamed our system to produce the files with extensions (these were cached version of converted data), and later that extension was skipped by the Antivir. But we would've got nowhere without procmon!Anonymous
December 08, 2010
Always look forward to these dubug guides. Gives us mere mortals a bit of a clue how to fault find more complex issues.Anonymous
December 10, 2010
Wonderful example of how to use this great tool. I had the exact same problem on a heavily used web server where log files, images, cache files, etc. caused the same problem.Anonymous
December 10, 2010
Dennis -- The ZwCreateFile is used for both creating a new file and opening one. msdn.microsoft.com/.../ff566424%28v=vs.85%29.aspx Cheers!!Anonymous
December 12, 2010
Tx for this sharing, it lets me discover new tracks to some performance or locking bugs in my every day professional life. An other tool I use too is Fiddler to inspect the network traffic.Anonymous
December 16, 2010
Every post makes me a better troubleshooter. Thanks for sharing this infoAnonymous
March 02, 2011
I have to deal with performance bottlenecks of complex enterprise applications, sometimes I feel lost before I even begin but these posts "Cases of" are very enlightening and show real-world solutions achieved with tools that are freely available. Please keep them coming!


