Performance Reports – The easy way
UPDATE
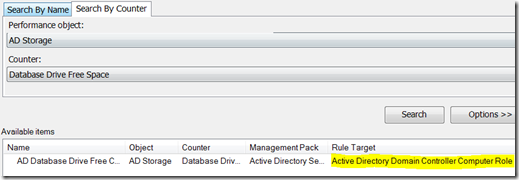
In SCOM R2, performance reports are much easier to run. This article describes how to find target classes and objects for the performance report object picker, which was a real hassle pre-R2. There is a new column included in the object picker, which resolves target classes, which can be used to search out the appropriate objects to add to the report.
Using the same example in the original post below, we can now see the target class in the object picker, which makes it unnecessary to run the command shell parts I describe below.
See the yellow highlighted target column, now available in R2. 
Original post follows…
Okay, so why am I blogging on this if it’s so easy then? Performance reports have always raised questions with customers, because it’s actually a little confusing trying to create one for the first time. And sometimes its’ confusing creating one after 10 tries! Here I’ll show you a process that has worked well for me, to get the data I want every time I create a performance report.
Keep in mind that, once a performance report is created it is usually saved to Favorites or published. This cuts the work out of creating reports over again in the future. Let’s get started.
There are basically two ways to create a performance report.
1. Based on a rule
2. Based on Windows Performance object\counter
The first one implies that you know what collection rule is sampling which counter. Often times, we don’t know what rule is collecting which counter. If the rule name isn’t descriptive enough to include the object\counter name, it can take some time to figure out what rule is sampling the counter you are interested in.
Frankly, who cares what rule is sampling the object\counter of interest? Since most people generally think about creating a performance report for a particular object\counter, and not necessarily thinking about what rule they want to see in a performance report, I’m going to focus on creating a report based on object\counter.
Create the report
Open the Operations Manager Command Shell and Operators Console.
Note: If you don’t have the Command Shell installed on your workstation, I highly recommend installing it at your earliest convenience. I don’t know how any Operations Manager operator or administrator can live without it.
In the Operators Console, navigate to Reporting > Microsoft Generic Report Library > open Performance report.
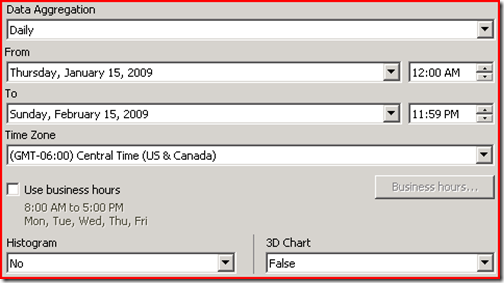
Specify your desired data aggregation and date/time range.
Tip: Specify from 12:00AM to 11:59PM for times, to return data for full first and last day in range.
Click Change in the upper-right corner to open the Object Picker.
In the Object Picker, click New Series to add a new line item.
In the Rule area, click Browse.
In the Select rule window, click Search By Counter.
Open the Performance object drop-down list, and select the object you want to see in your report.
Note: This list is not very well sorted. Search the entire list for your object.
Open the Counter drop-down list, and select the counter you want to see in your report.
In this example, I have selected to view AD Storage\Database Drive Free Space performance data in my report.
Click Search and select the item in the Available items pane. Then click Ok.
Note: In some cases, you might see some identical counters.
In this case, select one of them and click Search. You’ll see just as many items returned as there are duplicate counters. No need to search on each of these identical counters. Each item will be returned by only searching one counter, and each is referencing a different rule.
Look at the rule names and select the most appropriate match for the data you want to see in your report, and click Ok.
Now, in the Rule area, highlight the rule name and copy.
In the Command Shell
Without closing the performance report we’re working on, switch to the Operations Manager Command Shell. Copy the following command and paste it into the shell, substituting the rule name on your clipboard that you just copied from the last step.
$rule=get-Rule | Where {$_.DisplayName -eq "rule name"}
foreach ($id in $rule)
{
get-monitoringClass | where {$_.Id -eq $id.target.id.tostring()} | select DisplayName
}
The command will return data similar to the following.
Note the result and switch back to the performance report we have in progress. We should still be in the object picker. Click Add Object.
Click Search in the Add Object window. This will return a list of all the classes, types and type specializations in the Management Group.
Sort this list by clicking on the Type column header. Find the Type that was returned from the Command Shell output earlier. In the case of my example, this would be Active Directory Domain Controller Computer Role.
One thing to note here is, workflows that add multiple objects to the same instance (like SQL DB Engine can add multiple databases to a SQL instance), there may be some guess work involved. Luckily, it’s not difficult to ascertain the object in which you’re interested in reporting on, because these are generally well-known named objects. In the case of the Database Free Space % collection rule, this will be easy to find in the object picker and you probably don’t even need to find the type with the powershell command above.
Where’s my Type?
If you do not see your exact type in the list, this is because the type that was returned from the Command Shell output has been specialized.
Keep this in mind: Types are often specialized for Windows Server 2000, 2003 and 2008.
So, in my case, I see that the type I’m looking for is actually specialized. I can see in the list there are two objects of same type (for Server 2003), because I only have Server 2003 Domain Controllers in my environment. If you have Windows Server 2000 or 2008 Domain Controllers, you’ll see those type specializations in the list as well.
Also note the object Name column. I want to run this performance report for DC-1.
I select the DC-1 object, which is of Type: Active Directory Domain Controller Server 2003 Computer Role.
The bottom half of the Add Object window, click Add. Then click Ok.
You should now have a main Object Picker window similar to the following.
You may add additional objects for as many servers you’d like to see on this report by clicking New Series. This will add another line item to the chart. Then add the objects to the chart following the same steps.
Click Ok when finished adding objects. Then click Run in the upper-left of the main Performance report screen. You should now have a report similar to the following.
Voila!
Notice that I actually added an additional object to this report; the other object of the same type in the available items list in previous steps.
As an added bonus, if you click on one of the chart lines, this will open the Performance Detail report for that object, passing the object/counter/rule to the detail report.
What are you going to do for your next IT meeting? I’ll tell you what you’re going to do. You’re going to run a few of these performance reports and knock the socks off everyone in the room, and you’re name will be shouted out loud with cheer and praise.
Comments
Anonymous
January 01, 2003
Yesterday I was at a customer explaining OpsMgr Reporting and how they could start creating custom OpsMgrAnonymous
January 01, 2003
The comment has been removedAnonymous
January 01, 2003
Awesome post Sir And yes i really knocked the socks off everyone in the meeting room :) Many ThanksAnonymous
January 01, 2003
@rick283 Thanks for pointing that out. After I did a little more digging, I saw the same error you were getting. This was because the script wasn't iterating through each rule with the same name. Fixed that.Anonymous
January 28, 2011
it is good for the reporting prospective but must have access on reporting SCOM server or reporting freature should be isntalledAnonymous
June 29, 2012
Am not getting the Microsoft Generic Report Library folder in the Reporting.. Can Any one help me out please..


