How to use Performance Monitor Wizard (PerfWiz) on SBS
You can download PerfWiz from here;
https://www.microsoft.com/downloads/details.aspx?familyid=31fccd98-c3a1-4644-9622-faa046d69214&displaylang=en
Many times when you have performance issues on your server you can use this tool to simplify creating performance counters. This will benefit you in the following way; you don't need to do this one by one manually and this would be a head start before you call for support. Because for most performance issues you may find that we would want to collect this from your system.
So here is a step by step on how can do this;
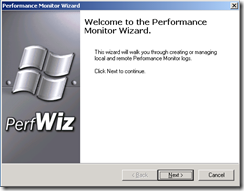
1>
2> Enter your server name here, (Most likely it will populate on its own)
3> If you are running this for the first time, then you don't really see many options here.
However if you are running this for the second time, then you may choose to make changes to the old one.
4> Set a “Standard Perfmon” if you are not sure about the exact issue yet or if some process is taking high CPU usage you can choose 'High CPU Usage'.
5> SBS can never be a Terminal Server, so the choice is pretty clear here, "Exchange Server".
- Again the server name should automatically populate.
6>
- Change the log files size to 50MB so that it’s small enough to be uploaded.
- Do not check the “continue logging in next file” option. It will overwrite the previous files and they get rid of the files that were created before the issue.
- You can change the location of the logs if you wish. (Just remember where you kept them.)
7>
- "Average Time to Issue" is basically asking you how frequently the problem occurs.
- The Sample interval should automatically change as per "Average Time to Issue" however if the issue occurs very frequently you may want to change it to get more samples.
8>
Then Simply click on START to start logging. You can click next when you see "Log Status: Running" and then Finish.
Wait till the issue reoccurs and once your serve recovers you have analyze it!


