Introducing the Extended Events User Interface
Check out What's new for Extended Events in SQL Server Codenamed "Denali" CTP3 for an overview of all of the new functionality released in CTP3. This post details the new user interface. In my overview post I mentioned that the user interface is built directly into management studio (SSMS) and that there are four parts:
- The session list in Object Explorer.
- A Create Session wizard.
- A Create Session dialog.
- A display grid.
This post focuses on the mechanisms for creating event sessions and displaying event session data.
Creating and modifying event sessions
The New Session Wizard and dialog share many common UI elements, so I’ll just cover the dialog. If a notable difference exists for the wizard, I’ll call it out at the appropriate place. A picture is worth a thousand words, so here is the pictorial tour of the new user interface.
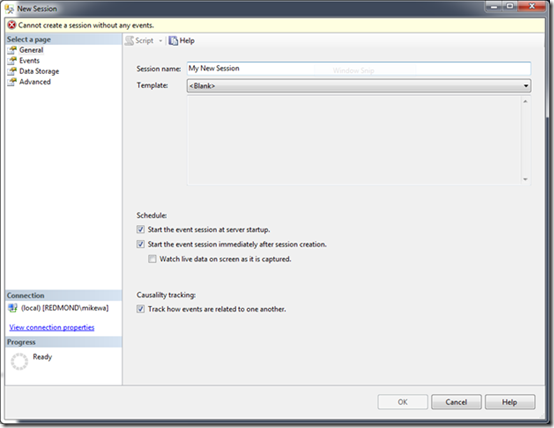
General page
The General page collects the basic information about the session:
· Name – You can figure this one out.
· Template – We’ve carried over the idea of templates similar to SQL Profiler. You can export any session you’ve created to a template (Expand the context menu of your event session and click Export Session… ). If you save the template to the default location, it will show up in this dropdown under the User Templates category.
· Schedule – You can choose to make this an Autostart event session, start the session immediately after you complete the dialog and even choose to start up the event stream viewer. (More on that later.)
· Causality Tracking – Turn on the correlation ids in your trace.
Wizard differences: These options are spread across three different wizard steps.
Event page - Library
The Event page has a couple parts. The Event Library allows you to select which events you want to add to your event session. The library supports Excel-like filtering using dropdown lists for Category and Channel. You can also search for specific events by just typing in the search text box. You choose an event by double-clicking or by selecting it and clicking the right arrow to move it to the Selected events list. We support Shift+Click and Ctrl+Click for choosing multiple events at once.
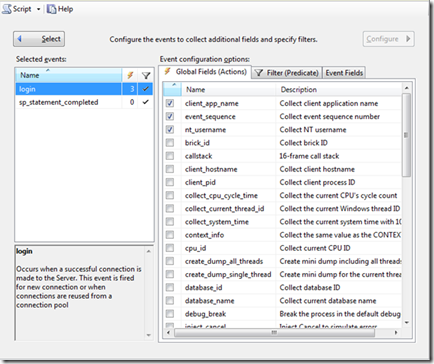
Event page – Configure
In Extended Events, each event can be extended to include additional data or cause a specific action, only fire under defined conditions and to enable optional fields. Clicking on the Configure button takes you to the advanced event configuration options. You configure an event by selecting it in the Selected events list and then setting the configuration options on one of the tabs. When you select multiple events, the configuration options will apply to all selected events.
The Global Fields (Actions) tab allows you select the list of Actions that you want to append to the event(s).
The Filter (Predicate) tab is used to define the conditions under which the event will be collected.
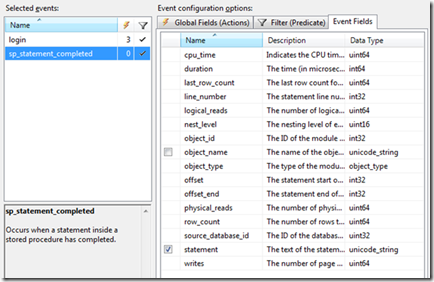
The Event Fields table allows you to enable or disable the collection of optional fields. (Fields without a checkbox are always collected.) You can also see the description and data type of each field on this tab.
Wizard differences: Global Fields and Predicates apply to all selected events. You cannot configure the events individually.
Data Storage page
You determine how the event session data is stored on this page by specifying the target for the session. You can specify more than one target for any session, but you can only use each target once. Each target will present a set of configuration options on the bottom of the page.
Wizard differences: The wizard supports only the event file and ring buffer targets.
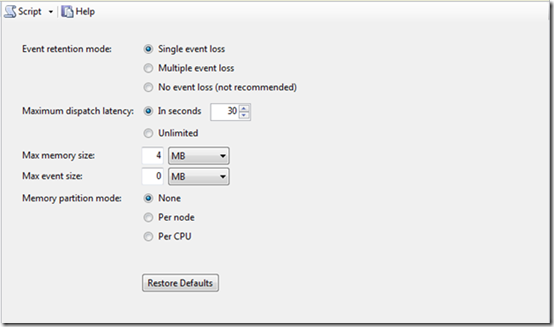
Advanced page
Configure the options for the entire event session here. We use the same defaults you would get with the DDL syntax.
Wizard differences: You cannot configure the event session options in the wizard, the defaults are used.
Other stuff
You may have noticed from the screen shots that you can script out your configured event session from the user interface using the button at the top of the page. The button becomes enabled as soon as you have enough of the event session configured such that the DDL would execute without error.
You can change the configuration of an event session by right-clicking the session name in Object Explorer and clicking Properties. The same user interface will be presented showing all your configured settings. Most settings can be changed on a running session, but you’ll need to stop the session to change the Advanced options. You cannot change the target configuration (Data Storage page) on an existing target, you’ll need to delete the target and re-add it to change that. You will also find that the Script button is not enabled in the Properties dialog, you can still script your event session to DDL, but you’ll need to do it from Object Explorer by right-clicking the session name and choosing one of the Script Session as… commands.
Wizard differences: The wizard is not re-entrant. Sessions created in the wizard can be modified using the Property dialog just like any other session.
Viewing event session data
SSMS includes an event session data viewer for all of the supported targets with the exception of the ETW file target. (There are many other tools for working with ETL files.) There are basically two different types of event session data display.
In-memory targets
The in-memory targets include: ring buffer, event counter, histogram and event pairing. The data from these targets is displayed in a simple grid format.
By default you see a “point in time” view of the data when you opened the display. You can either manually refresh the data or have it refresh on a schedule from the context menu. The ring buffer is a bit special in that the display shows you a single row containing the XML output of the ring buffer. You can double-click the row to open an XML document, but there is no event by event grid view for the ring buffer, sorry.
Event stream and event file
You can open a “live view” of a running session by right-clicking on the session name and choosing the Watch Live Data menu item. This will open a page in SSMS that provides you with a scrolling display of the events as they come from the event session. This is similar to the behavior that exists in SQL Profiler with the major difference being that Extended Events does not cause the performance degradation that you might be used to with SQL Profiler. Extended Events will never block the server waiting for the client event stream view; we’re so serious about this that the event stream is disconnected if the client becomes too slow that it will block the server workload. (Remember the prime directive – this is one of those tradeoffs.) If you have a very busy server (eg. lots of events) the file target will be a more appropriate target.
The event file target uses the XEL extension by default, and that extension is associated with SSMS so that you can open an event file by double-clicking or simply dragging it onto the SSMS window. You can also open event files in two different ways from the File menu:
File | Open | File – Pick an XEL file and click Open
File | Open | Merge Extended Event files – Use the dialog to collect multiple files to be merged
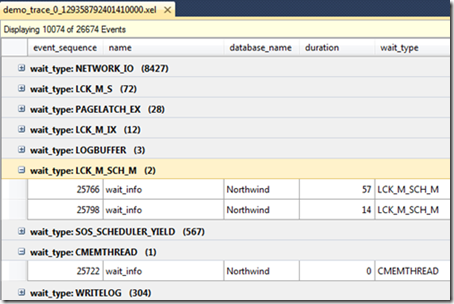
Both the event steam and event files are displayed in the same user interface:
The picture is a bit small, but you get the idea. Open up an XEL file in SSMS to get the full experience.
The first thing you won’t notice, but now you will because I’m telling you, is that there is a custom toolbar for Extended Events; there is also a menu added. You can control all the functionality of the display UI using these. The first thing you will notice is that the default view has only two columns, name and timestamp, all the other columns for an event are shown in the Details pane when you select a specific row in the grid. There is a bunch of functionality in this UI, almost too much to fit into a summary such as this, so I’ll hit the high points and let you explore.
· You can add additional columns to the grid by either right-clicking the in the Details pane and choosing Show Column in Table or by clicking the Choose Columns button to open the Choose Columns dialog.
· You can Find event records using the typical SSMS find behavior.
· You can Bookmark records of interest and move between bookmarked records.
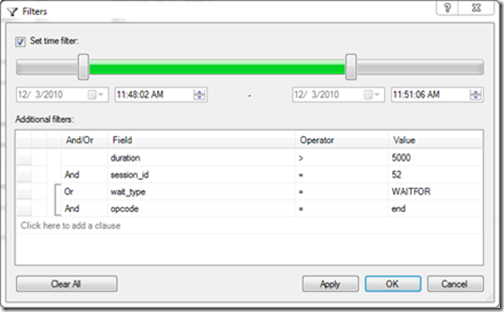
· You can apply a filter to the results using a flexible criteria builder. (This is worth a picture; so much better than SQL Profiler!)
· You can use the Grouping and Aggregation commands to do some basic analysis of your data directly in the display UI.
· You can save the configuration of the display table (columns, filter, sorting and group/aggregation) using the View Settings button. (Note: This button name may change before RTM.)
· You can export the list of events to a SQL Server table, CSV or XEL using the Export to menu item. (Note: This is only on the menu, not the command bar.)
· You can Start and Stop the collection of the data and control the scrolling of the data in the window for the event stream.
That about wraps up the pictorial tour of the new Extended Events user interface. Take it out for a spin and let us know what you think. If you find any problems, or have suggestions for future versions, please post them to Microsoft Connect. If you have questions, post them to the SQL Server Database Engine forum.
Happy Eventing!
- Mike
Comments
- Anonymous
December 22, 2014
Great article, thanks! also great detail on this topic in this great video sqlturbo.com/presentation-introduction-to-sql-server-extended-events
