Doubled records in Excel output of a SSRS Report with expandable regions
Some customers have lately raised the discussion around, what they thought it was, a misbehavior of the Excel Rendering extension when dealing with expandable regions. The behavior can be described as follows.
On Reporting Services 2008, we are exporting to excel a report with multiple row groups with visibility triggers on every group, the visbility being controlled by the parend group. This produces a report with interactive functionality - Expandable regions. While in HTML, the report looks and works fine, in Excel the last group will display a duplicate record below the data record.
Exemplified on an AW report, this behavor will look like below.
HTML Rendered Version:
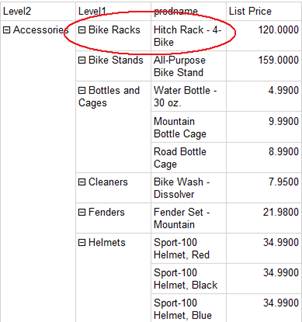
Excel version showing doubled records:

The behavior we are currently seeing – duplication of the details row is caused by the following. In order to support expandable regions in excel, we need to have rows that will be collapsed or expanded. In excel, on the last row of a grouping, we will need to have the values that will be displayed on the row visible while in collapsed state. Apart from this last row, we’ll need to have the rows visible while in expanded state.
The apparent difference between HTML and Excel comes from a difference in behavior related to expandable regions in Excel vs. HTML. Logically the two solutions are the same. The main problem comes from a minor fault in design of the report.
In HTML, you rely on an empty row just before the real values, so that when collapsed, the cell on level 7 is empty. This solution doesn’t work while in Excel, because Excel will actually take the last row to put it in collapsed state and not the first. Therefore, it will appear as the data is different while they both contain the same data.
The solution would be to redesign the expandable regions and the table of the report so that you achieve the needed result.
I will exemplify with the AdventureWorks report below.
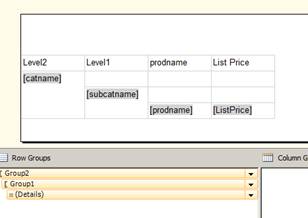
Initially, the report’s design looks like this:
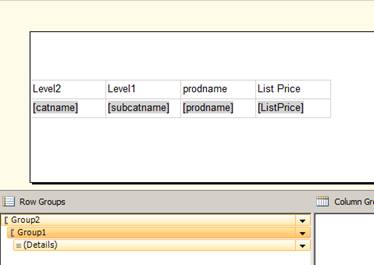
Even though we have multiple levels of grouping, we only have one row.
Since in collapsed mode, on the details we need the sum of the prices and no name for the products, what we should do is make sure that we create headers for our group like below:
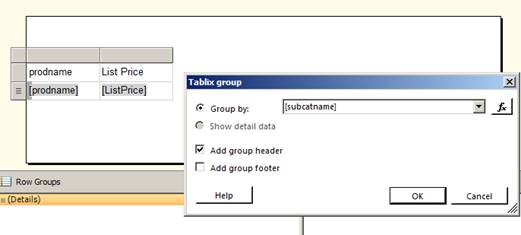
This will produce:
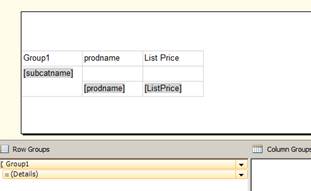
We do this once again to add the second level and we will have:
Now, if we add visibility settings accordingly, we will have expandable regions like below:
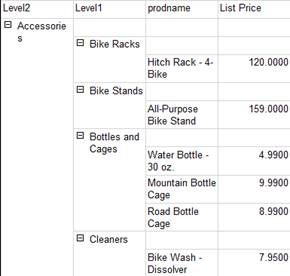
If collapsed, they will not show a product name (OK) but will also not show a total price (KO). For this, all we need to do is add a total to the corresponding cell in design:
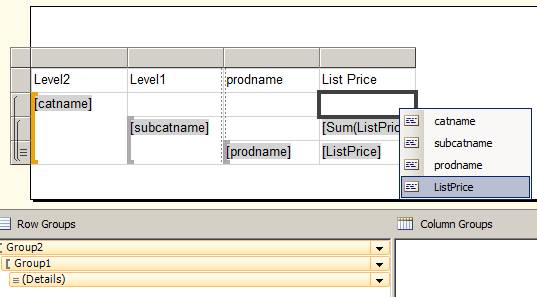
Just selecting the correct field from the list will automatically add the Sum, which is exactly what we need.
Now, our collapsed report will look like this in HTML:
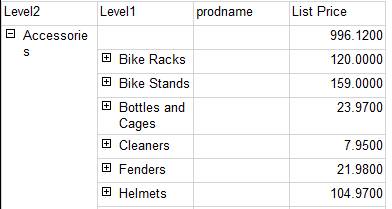
And finally, in Excel we have the expected result as well:
Collapsed:
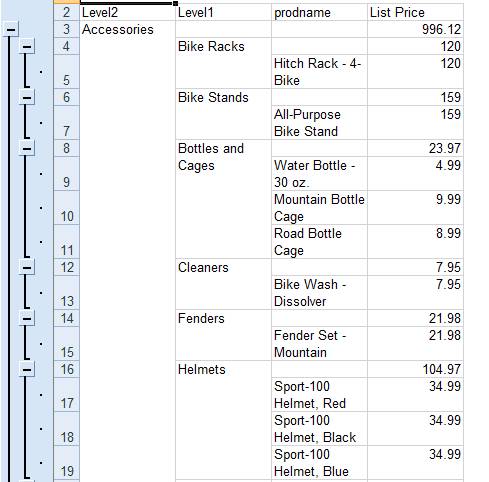
You can see that the problem is solved and the report contains the correct layout and data.
Basically our problem comes from a small design issue that not only that produces this limitation, but also might produce incorrect results.
--
HTH
Comments
- Anonymous
June 28, 2010
Select field ....... then Go to properties and select HideDuplicates = datasetName