SQL High CPU troubleshooting checklist
Hello all,
In this blog, I am covering the scenario of an approach to troubleshoot "SQL Server consuming High CPU" and few checklist points which will help in isolating/troubleshooting.
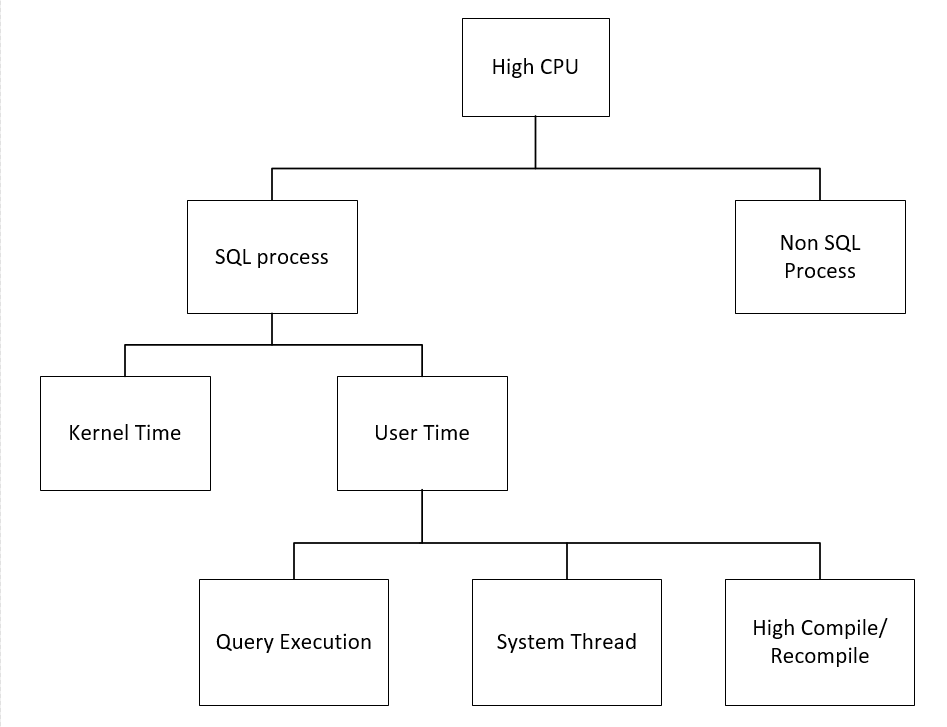
Below screenshot summarizes an approach to isolate SQL high CPU issues:
CHECKLIST POINTS:
1. From Windows task manager check the overall CPU utilization. Collect the details of number of logical processors present on the box.
2. From task manager, check the SQL Server process CPU utilization. Is the SQL CPU constantly above 70%?
3. Gather the following details:
- How do you typically become aware that CPU is the bottleneck?
- What is the impact of the problem? Are there particular errors that your user application?
- When did the problem first occur? Are you aware of anything that changed around this time? (Increased workload? Change in table size? App upgrade? SQL upgrade?)
- Can you make new connections to the server during the problem period?
- How long did the problem last? Have you been able to do anything that seemed to help resolve the problem?
- What system-level symptoms have you observed during the problem periods? For example, is the server console slow or unresponsive during the problem periods? Does overall CPU usage increase? If so, what %CPU is observed during the problem? What is the expected %CPU?
4. If the High CPU is causing by process other than SQL Server process (sqlservr.exe) engage the team which takes care of that process.
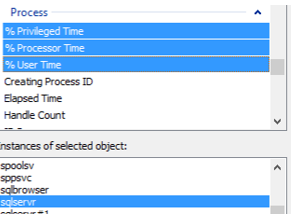
5. Open Perfmon and add the below counters:
Process (sqlservr):
% Privileged Time
% Processor Time
% User Time
Processor
% Privileged Time
% Processor Time
% User Time
6. If Processor Privileged time is above 25%, engage the Windows team
Processor Time = Privileged Time + User Time.
7. Confirm that SQL is consuming high CPU on the box by validating the below counters:
Process (sqlservr): % Privileged Time
% Processor Time
% User Time
Divide the value observed with the number of logical processors to get the CPU utilization by SQL Process.
If (Process (sqlservr)% Privileged time/No of Procs) is above 30%, ensure that KB 976700 is applied for Windows 2008 R2
This step, gives an indication of if SQL Server is causing the high privilege time on the server. If SQL privilege time is high, as per the above calculations, engage the Windows team.
8. Check the below configurations from sp_configure and make sure they are as per the best practice recommendations:
Follow KB 2806535 for Max DOP recommendation settings.
9. If you are unable to connect to the SQL instance locally using SSMS, try connecting to SQL instance using Dedicated Admin connection (DAC) using:
ADMIN: Servername
10. Get the top 10 queries consuming High CPU using below query:
SELECT s.session_id,
r.status,
r.blocking_session_id 'Blk by',
r.wait_type,
wait_resource,
r.wait_time / (1000 * 60) 'Wait M',
r.cpu_time,
r.logical_reads,
r.reads,
r.writes,
r.total_elapsed_time / (1000 * 60) 'Elaps M',
Substring(st.TEXT,(r.statement_start_offset / 2) + 1,
((CASE r.statement_end_offset
WHEN -1
THEN Datalength(st.TEXT)
ELSE r.statement_end_offset
END - r.statement_start_offset) / 2) + 1) AS statement_text,
Coalesce(Quotename(Db_name(st.dbid)) + N'.' + Quotename(Object_schema_name(st.objectid, st.dbid)) + N'.' +
Quotename(Object_name(st.objectid, st.dbid)), '') AS command_text,
r.command,
s.login_name,
s.host_name,
s.program_name,
s.last_request_end_time,
s.login_time,
r.open_transaction_count
FROM sys.dm_exec_sessions AS s
JOIN sys.dm_exec_requests AS r
ON r.session_id = s.session_id
CROSS APPLY sys.Dm_exec_sql_text(r.sql_handle) AS st
WHERE r.session_id != @@SPID
ORDER BY r.cpu_time desc
11. Check the wait type of the queries returned from the above output. If CPU is the major bottleneck, most of the sessions will have the below waits:
SOS_SCHEDULER_YIELD
CXPACKET
THREADPOOL
If most of the queries are waiting on CXPACKET, revisit sp_configure setting for “Max degree of parallelism” and “Cost degree of parallelism” and check if they are set as per best practice recommendations.
12. Run the SQL Standard report to get the list of Top CPU queries:
Right Click on the instance, go to reports> Standard reports
Check the Top CPU queries obtained in the report. Compare the report with the Top CPU consuming queries obtained from above step.
13. Once the top CPU queries are identified, get the list of all the SQL tables involved using statement_text and command_text column output obtained from step 10.
Check the following:
Index Fragmentation on the top CPU driving tables
Last Statistics updated information
If the Index fragmentation is above >30 %, rebuild the index. If the statistics are not updated on the table, update the statistics.
From the Top CPU queries, if there are only few set of tables which are responsible for high CPU, share the tables list with the application team and share the statistics report and fragmentation report.
Check if there are any select queries which are causing high CPU, check with application team if they can be stopped temporarily on high OLTP servers.
14. Once the database maintenance activity is performed (like Index rebuild and Stats update), if SQL is still using high CPU, execute the query mentioned in Step 10.
Check if the Top CPU query has changed. If the query has changed, then follow the action mentioned in Step 13. If the query is still the same, then go to next step.
15. Collect the estimated execution plan of the top CPU consuming queries involved using:
Query 1: Get the Top CPU consuming session ID’s from the output of query mentioned in step 10.
Collect the Plan handle and SQL handle information from below query:
select sql_handle,plan_handle from sys.dm_exec_requests where session_id=<session_id>
Get the text of the query:
--replace the SQL Handle with the value obtained from above query.
select * from sys.dm_exec_sql_text (sql_handle)
Get the estimated execution plan of the query:
--replace the Plan handle with the value obtained from above query.
select * from sys.dm_exec_query_plan (plan_handle)
Query 2: The below query captures the Total CPU time spend by a query along with the plan handle. Plan handle of the query is needed to get the estimated execution of the query.
select
highest_cpu_queries.plan_handle,
highest_cpu_queries.total_worker_time,
q.dbid,
q.objectid,
q.number,
q.encrypted,
q.[text]
from
(select top 50
qs.plan_handle,
qs.total_worker_time
from
sys.dm_exec_query_stats qs
order by qs.total_worker_time desc) as highest_cpu_queries
cross apply sys.dm_exec_sql_text(plan_handle) as q
order by highest_cpu_queries.total_worker_time desc
16. Share the estimated execution plan obtained with the application team.
Check for the operator which has high Cost.
Check the Indexes used for the operator and number of rows estimated.
Revisit the statistics and Indexes on the table reported for the operator which has high cost and make sure that there are no stale statistics.
Check if the estimated execution plan is recommending any new index to be created. If the plan reports an index recommendation, share the missing index details with the Application team.
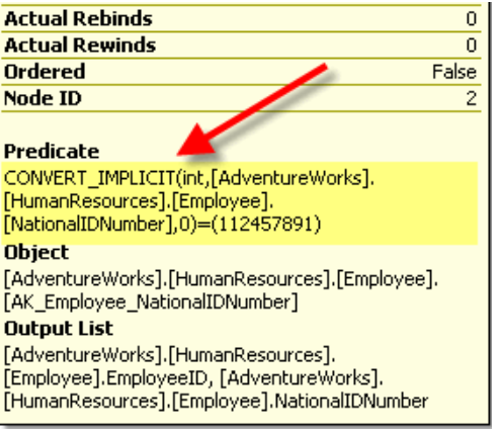
17. “Convert Implicit” function in execution plan can result in High CPU utilization of SQL Server as well.
Review the execution plans of the High CPU consuming queries and review the Operator with High Cost and check if there are any Convert_Implicit function is called.
In the above screenshot, CONVERT_IMPLICIT function is implicitly converting the column “NationalIDNumber” to integer whereas in the table definition its defined as nvarchar (15). So, share the report with application team and ensure that the data type passed and stored in database are having the same data type.
18. Run the missing index query on the database which has reported high CPU and check if there are any missing indexes recommendations. Share the Index recommendation report with the Application team
19. Tune the Top CPU consuming queries with the Database Engine Tuning Adviser to see whether database engine recommends index recommendation/statistics creation.
20. Check for Compilations/Re-Compilations in SQL Server:
From perfmon, capture the below counters:
SQL Server: SQL Statistics: Batch Requests/sec
SQL Server: SQL Statistics: SQL Compilations/sec
SQL Server: SQL Statistics: SQL Recompilations/sec
Batch Requests/sec: Number of SQL batch requests received by server.
SQL Compilations/sec: Number of SQL compilations per second.
SQL Recompilations/sec: Number of SQL re-compiles per second.
If the recompilation count is high, check for below:
Any Schema changes
Statistics changes
SET option changes in the batch
Temporary table changes
Stored procedure creation with the RECOMPILE query hint or the OPTION (RECOMPILE) query hint
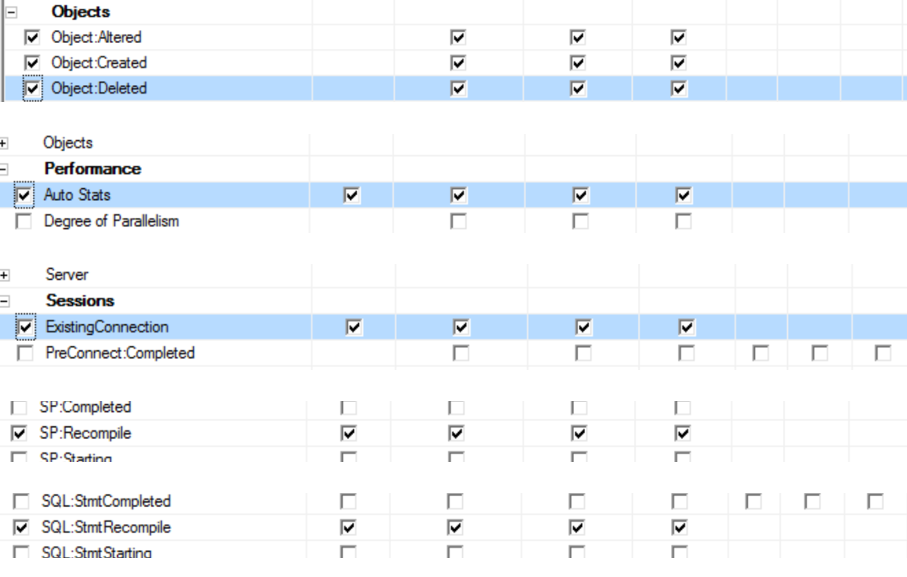
From SQL profiler, add the following events and check the stored procedures which are getting recompiled frequently.
21. Check if SQL System threads are consuming high CPU:
select * from sys.sysprocesses where cmd like 'LAZY WRITER' or cmd like '%Ghost%' or cmd like 'RESOURCE MONITOR'
Ghost cleanup thread >>>> Check if the user deleted large number of rows
Lazy Writer thread >>>>>>> Check if any memory pressure on the server
Resource Monitor thread >> Check if any memory pressure on the server
22. If the Top CPU consuming queries has the wait type: SQLTRACE_LOCK, check there are any traces running on the server using:
select * from sys.traces
23. Collect the PSSDIAG during the Top CPU issue time. Refer KB 830232. Load and Analyze the data in SQL Nexus tool.
24. Even after implementing above action plans, if the SQL CPU utilization is high, then increase the CPU on the server.
Hope the above steps mentioned will help you in troubleshooting SQL High CPU scenarios.
Happy troubleshooting!
Please share your feedback, questions and/or suggestions.
Thanks,
Don Castelino | Premier Field Engineer | Microsoft
Disclaimer: All posts are provided AS IS with no warranties and confer no rights. Additionally, views expressed here are my own and not those of my employer, Microsoft.
Comments
- Anonymous
January 05, 2018
An excellent doc! Thanks - Anonymous
February 05, 2018
Amazing!! This is the exactly what I was looking for. Thanks for share! - Anonymous
February 15, 2018
Excellent! Thanks. - Anonymous
February 23, 2018
Excellent !!Thank you - Anonymous
May 07, 2018
Thank you for the amazing article. - Anonymous
July 17, 2018
wonderful article, that is what I was looking for.Thank you, - Anonymous
July 19, 2018
Simply great info!!!Thanks a lot :) - Anonymous
September 03, 2018
superb, THanks lot - Anonymous
September 04, 2018
Perfect Article for CPU issue !! - Anonymous
September 18, 2018
Excellent. Thanks. - Anonymous
September 20, 2018
Excellent doc. - Anonymous
October 26, 2018
The comment has been removed - Anonymous
November 19, 2018
It's awesome post, really very good document. Thank you! - Anonymous
November 21, 2018
The comment has been removed


