How to remotely debug and profile the performance of your HTML5 websites & apps on Windows Phone
People are often asking me this recurrent question: how do I remote debug my website/app on a Windows Phone? Let me share the various ways to do it.
Since Visual Studio 2013 Update 2 and Windows Phone 8.1, the experience is getting much better. We will first see how to use this tool which enable html/css, JavaScript & even performance debugging!
I’ll share also at the end some great content demonstrating how to use WEINRE to debug layouts of Windows Phone HTML5 apps (PhoneGap/Cordova included).
First, please download & install this free version of Visual Studio 2013 Express for Windows. It contains the Windows Phone 8.1 emulators in which you’ll test your websites with IE11 Mobile.
How to debug an existing public websites
Launch Visual Studio 2013 you’ve just installed then go to “DEBUG” –> “Other Debug Targets” –> “Debug Windows Phone Internet Explorer” (Ctrl+Shift+P)
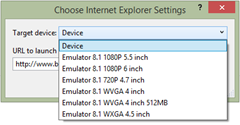
Then, enter the URL to launch and choose the emulator version you’d like to test your website against:
Please note that you can remote debug the code & layout on a real Windows Phone via USB if you’re lucky enough to have one.
Note: I’m using the “Blue” color theme. First time you’ll launch Visual Studio, you will use by default the “Dark” color theme. That’s why my screenshots may slightly differ from your screen.
Ok, let’s do our tests on our Babylon.js official website: https://www.babylonjs.com on a “WVGA 4 inch” emulator.
You can see the “DOM Explorer” on the left where you can navigate the IE Mobile DOM to review the HTML output, review the CSS applied & dynamically modify them to fix your layout if needed.
Press on the “Select element” button:
And then click on the “Train” thumbnail in the Windows Phone emulator. You’ll jump directly in the right place in the DOM as shown in the upper screenshot.
You can also debug the code using the power of Visual Studio. For that, navigate into the “Solution Explorer” pane and double-click on “lines.js”.
Set a breakpoint on the first line:
var scene = new BABYLON.Scene(engine);
If you don’t know how to set a breakpoint in Visual Studio, simply left-click in the first column in front of the desired line of code or right-click the line of code –> “Breakpoint” –> “Insert Breakpoint”. The background color will change to red and you’ll have a red circle in the first column.
Now navigate to the demo named “Lines” in the “Features tests” section and launch it. You’ll be able to debug our code using VS on a remote Windows Phone. Press F10 to step over (move from a line to another), F12 to step into (jump into the source code of the current JS function for instance) or F5 to continue.
Still not clear enough? Watch me following these steps in this 4 minutes video:
If you’re an ASP.NET developer, you can also debug your code on Windows Phone in the same way using the same debug button you’re used to:
Profiling the performance
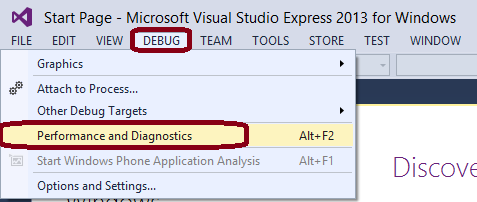
Let’s now see how to profile the performance of your website on a Windows Phone running IE11 Mobile. In Visual Studio 2013 Update 2, navigate to “DEBUG” –> “Performance and Diagnostics”
Note: this is the same tool available inside the F12 development bar of Internet Explorer 11 on desktop: Profiling JavaScript performance
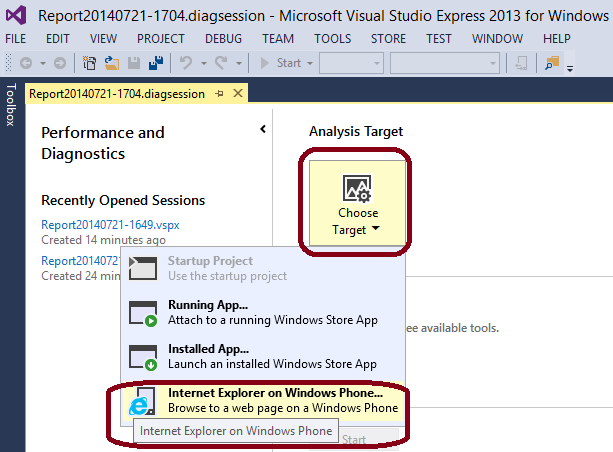
The tool asks you to choose a target. Choose “Internet Explorer on Windows Phone”:
Choose the “Device” as the target device instead of one of the emulators. Indeed, there is no interest to profile the performance of the emulators as they are not reflecting at all the performance of real devices.
You’ve got 4 tools available: “CPU Sampling”, “HTML UI Responsiveness”, “JavaScript Function Timing” & “JavaScript Memory”.
For instance, here are the results when I’m profiling our physics demo on https://www.babylonjs.com/index.html?PHYSICS on my Nokia Lumia 1520.
The 1st graph shows where are the “hot paths” and we can see here that the sphereBox() JavaScript function cost a lot of performance.
If you click on sphereBox(), you’re jumping directly in its source code and you can see a nice call stack diagram:
We can also see that this function lives inside the cannon.js library which is the physics engine we’re using.
You can use the very same approach on any website to profile the various performance parts and find the bottlenecks to try to optimize your CSS & code.
Here is a 5 minutes 30 video demonstrating how to use the “HTML UI Responsiveness” and “JavaScript Function Timing” options on 2 of our babylon.js demos:
Use weinre, WP8 and IE10 to debug your mobile HTML5 page remotely
Olivier Bloch has done some great job covering this topic already. He described in this article: Debug your mobile HTML5 page remotely with weinre (WEb INspector REmote) the various steps to install Weinre on top of Node.js to help you remote debug your HTML5 layout on Windows Phone.
Please note that this tool doesn’t help you live debugging your JavaScript code.
You can watch a demo in this short video:
Olivier demonstrated its usage via the HTML5 application template of Windows Phone but you can use the very same approach with Phonegap/Cordova!
Feel free to ping me on twitter if you’d like to discuss about this article.
Comments
- Anonymous
September 25, 2015
Hello, "Please note that you can remote debug the code & layout on a real Windows Phone via USB if you’re lucky enough to have one." The emulators and the phone results are different and I would like to debug my phone via USB but I can't manage to find a tutorial for that feature. Do you have any information about it? Thank you!


