VS2010: Profiler Guidance (rules) Part 1
The new guidance feature in the VS2010 profiler will look familiar to people who have used the static code analysis tools in previous versions. However, instead of statically analyzing your code, the profiler runs it and analyzes the results to provide guidance to fix some common performance issues.
Probably the best way to introduce this feature is via an example. Let’s assume you have written a simple application as follows:
    1: using System;
    2: namespace TestApplication
    3: {
    4:     class Program
    5:     {
    6:         static void Main(string[] args)
    7:         {
    8:             BadStringConcat();
    9:         }
   10:
   11:         private static void BadStringConcat()
   12:         {
   13:             string s = "Base ";
   14:             for (int i = 0; i < 10000; ++i)
   15:             {
   16:                 s += i.ToString();
   17:             }
   18:         }
   19:     }
   20: }
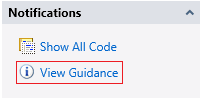
If you profile this application in Sampling Mode you’ll see an Action Link called ‘View Guidance’ on the Summary Page:
Clicking on this link brings up the Error List, which is where you would also see things like compiler errors and static code analysis warnings:
DA0001: System.String.Concat(.*) = 96.00; Consider using StringBuilder for string concatenations.
As you can see there is a 1 warning, which is DA0001, warning about excessive usage of String.Concat. The number 96.00 is the percentage of inclusive samples in this function.
Double-clicking on the warning in the Error List switches to the Function Details View. Navigating up one level of callers, we see that BadStringConcat is calling Concat (96% of Inclusive Samples) and doing some work itself (4%). The String.Concat call is not a direct call, but looking at the Function Code View you can see a ‘+=’ call on a string triggers the call.
The DA0001 rule suggests fixing the problem by changing the string concatenation to use a StringBuilder but I’ll leave that up to the reader. Instead, I’ll cover some of the other aspects of rules.
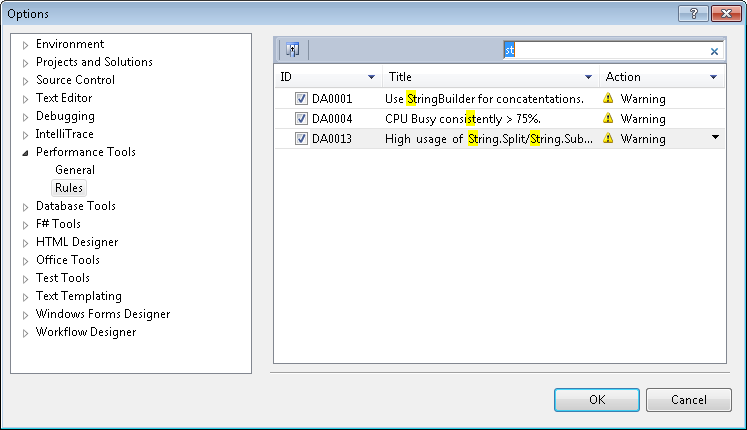
One of the more important questions is what to do if you wish to turn off a given rule (or even all rules)? The answer is to open up the ‘Tools/Options’ dialog and in the Performance section, navigate to the new ‘Rules’ subsection:
Here you can see that I’ve started searching by typing ‘st’ in the search box at the top. This dialog can be used to turn off rules (by clicking on the checkboxes on the left), or to change rule categories to ‘Warning’, ‘Information’ or ‘Error’. The only affect is to change how the rule is displayed in the Error List.
If you have a situation where you are sharing a profiler report (VSP file) with team members, sometimes it might be useful to let them know that a warning is not important or has already been considered. In this case you can right-click on the Error List and choose ‘Suppress Message’.
The rule warning is crossed out and you can choose to save the VSP file so that the next time it is opened, the suppression is shown:
That’s it for now. I plan on covering a little more about rules in a future post, including more details about the rules themselves, how you can tweak thresholds and even write your own rules.


