Debugging in NAV 2009
UPDATE 23 February 2009!!! Today my TAP partner GAC asked if it is possible to debug with Visual Studio Express 2008. I could not find any place where we have documented this, so I thought I would share the answer with the readers on this blog. And yes you can debug NAV 2009 with Visual Studio Express 2008. So a purchase of Visual Studio 2008 Standard is not required for this task. Please note that SP1 need to be installed also on Visual Studio Express.
Thanks,
Claus Lundstrøm, Program Manager, Microsoft Dynamics NAV
---
UPDATE!!! Debugging is not available in the Marketing Beta, so if you have access to a later build you can try this out. If not you will have to wait for RTM.
Also note that SP1 for either Visual Studio 2005 or Visual Studio 2008 is required.
---
In this post I will give you a example on how to debug in NAV 2009.
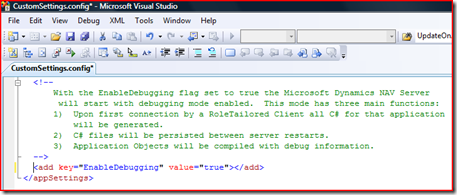
1. EnableDebugging in CustomSettings.config found here: C:\Program Files\Microsoft Dynamics NAV\60\Service
2. Now Restart the “Microsoft Dynamics NAV Server” service
3. Now we have debugging enabled. Now start the RoleTailored client. This will take a bit longer to start up, because C# files are generated for each of the objects. (Pages, Codeunits, Reports etc.)
4. Now we need to find a place to debug. In this example I will make a codeunit with a simple message and add this to an action on the Customer list.
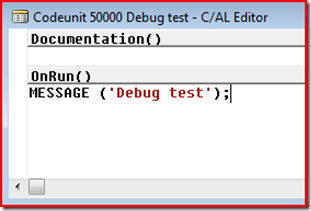
5. Create a Codeunit. Ex. 50000
6. OnRun trigger place the following code: MESSAGE ('Debug test')
7. Save and compile Codeunit 50000.
8. Now let us add this codeunit to a action. Design page 22 and navigate to the Actions on page 22.
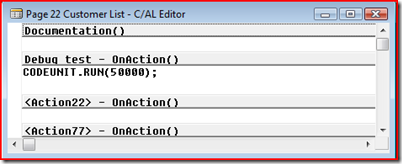
9. Insert a new action below the the Customer Action group
10. Hit F9 and enter this code on the Debug test - OnAction trigger: CODEUNIT.RUN(50000);
11. Save and compile page 22
12. OK we now have all code completed so now let us set a breakpoint in Visual Studio.
13. Navigate to “C:\ProgramData\Microsoft\Microsoft Dynamics NAV\60\Server\MicrosoftDynamicsNavServer\source\Codeunit”
14. Assuming that you have Visual Studio installed, (In my case I’m using Visual Studio 2008 with SP1) open Codeunit50000.cs
15. If you have UAC turned you will need to open Visual Studio with “Run as administrator”.
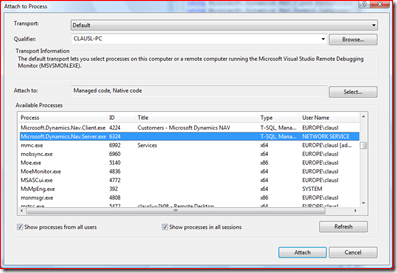
16. Now we need to attach the NAV service. Select “Debug / Attach to process…”
17. Attach Microsoft.Dynamics.Nav.Server.exe
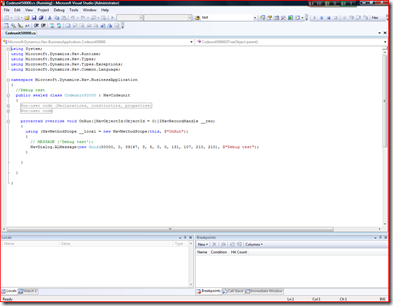
18. Your screen should now look like this:
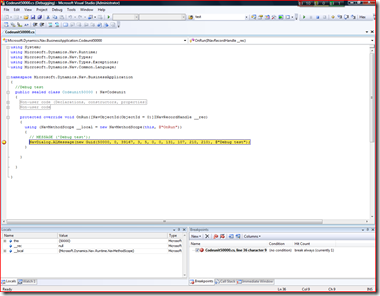
19. Now add a break point on the message “Debug test”
20, With this done now let us go to RoleTailored client.
21. Navigate to Customer List and see that you have a new action called “Debug test” under “Related Information”
22. Now select “Debug test”
23. Visual Studio will come back in focus with the breakpoint selected.
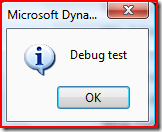
24. Now try to hit F5 and debugging will continue and RoleTailored client will come back in focus and show the message “Debug test”:
Thanks,
Claus Lundstrøm, Program Manager, Microsoft Dynamics NAV
Comments
- Anonymous
October 14, 2008
The comment has been removed - Anonymous
October 14, 2008
Thanks for that article. It is good to see the "first step" for using VS with NAV. Easy, simple, clear, usable... - Anonymous
October 18, 2008
I just tried this but I have problem with the debugging. I am able to enable the debug mode, the service is generating the source code for each object I use in RTC, that's ok. But when I try to connect the VS to debug the service application, VS crash, service crash too. May be some problem with UAC on Vista... (in event log there is error in module "mscorwks.dll"...) - Anonymous
October 28, 2008
http://blogs.msdn.com/clausl/archive/2008/10/14/debugging-in-nav-2009.aspx Hallo zusammen! Entgegen der - Anonymous
October 29, 2008
My first technical blog post is going to describe some details about the service tier, that some people - Anonymous
November 11, 2008
This is my first view of debugging NAV within VS so I apologize if my question is obvious. Does this mean that we're really debugging the C# code vs. the NAV code?
