FSharpChart release supporting Stacked Charts (version 0.60)
For the second release this week, FSharpChart now supports binding for Stacked Charts. As always, one can download the latest release from:
https://code.msdn.microsoft.com/FSharpChart-b59073f5
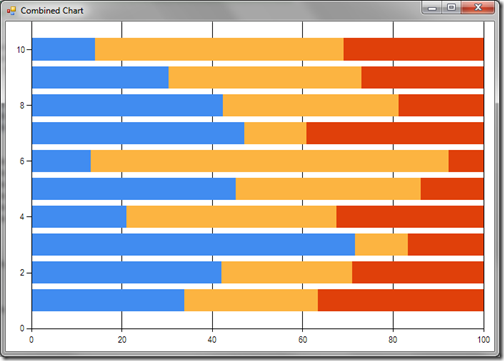
In previous versions of FSharpChart it was not very intuitive how a Stacked Chart could be plotted. What one had to do was define a CombinedChart where one defines the charts to be combined with the same StackedGroupName property value:
let rndStacked = new System.Random()
let dataX() = [ for f in 1 .. 10 -> rndStacked.NextDouble() * 10.0]
FSharpChart.Combine
[ FSharpChart.StackedBar100(dataX(), StackedGroupName = "g1")
FSharpChart.StackedBar100(dataX(), StackedGroupName = "g1")
FSharpChart.StackedBar100(dataX(), StackedGroupName = "g1") ]
This displays the following chart:
(Thanks to Tomas Petricek for this sample)
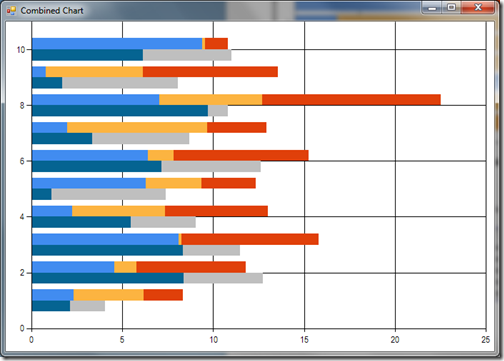
This approach also allows one to easily combine multiple Stacked Charts using different StackedGroupName properties:
FSharpChart.Combine
[ FSharpChart.StackedBar(dataX(), StackedGroupName = "g1")
FSharpChart.StackedBar(dataX(), StackedGroupName = "g1")
FSharpChart.StackedBar(dataX(), StackedGroupName = "g1")
FSharpChart.StackedBar(dataX(), StackedGroupName = "g2")
FSharpChart.StackedBar(dataX(), StackedGroupName = "g2") ]
This displays the following chart:
However, for Stacked Charts, a more intuitive approach would be just to specify a list of data series. With this new release one can now specify the data series using the following formats:
list<list<'TY>>
list<list<'TX * 'TY>>
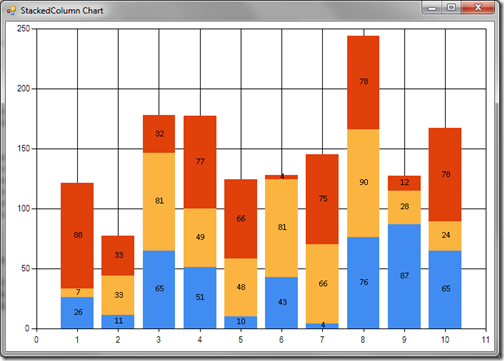
This now allows one to define, say a StackedColumn chart, using the much simpler expression:
let rndStacked = new System.Random()
let dataXY() = [ for f in 1 .. 10 -> (f, round (rndStacked.NextDouble() * 100.0))]
[dataXY(); dataXY(); dataXY()]
|> FSharpChart.StackedColumn
|> FSharpChart.WithSeries.DataPoint(Label="#VAL")
This displays the following chart:
Hopefully you will agree this is much simpler and more intuitive. The only current limitation of this binding approach is that one cannot use a CombinedChart for multiple Stacked Charts when binding in this fashion. If this is the desire then the previous approach with distinct StackedGroupName properties is needed.
The download also includes a new WinForms sample demonstrating how bindings can be managed for these Stacked Charts.
Don’t forget, the previous release also added the ability to add a Marker for a Data Series:
[ for i in 1. .. 20. .. 1000.0 -> i, rnd.NextDouble() ]
|> FSharpChart.Line
|> FSharpChart.WithSeries.Marker(Color=Color.Red, Style=MarkerStyle.Cross)
Again, the this displays the chart:
Once again enjoy!
Comments
- Anonymous
October 26, 2011
Thanks for also incorporating my fix for maintaining area, margin, and legend options when combining charts - Anonymous
October 27, 2011
Hi Carl,Thanks for putting together FSharpChart. It is turning out to be very useful!I am trying to use the Funnel chart but the labels are not showing up. The labels do show if I use the same data against the Pie chart. Any ideas?Regards,Faisal - Anonymous
October 31, 2011
Try adding |> FSharpChart.WithSeries.DataPoint(Label="#VAL")or if XY binding |> FSharpChart.WithSeries.DataPoint(Label="#VALX") - Anonymous
November 01, 2011
Thanks Carl! That works. - Anonymous
November 25, 2011
Hi Carl,What is a good way of updating data on a combined chart? With a single chart it's relatively straightforward using SetData but I could not find anything obivous when using a combined chart.Regards,Faisal - Anonymous
November 27, 2011
The comment has been removed - Anonymous
November 30, 2011
The process for calling SetData for a stacked chart should be the same as for BoxPlot charts. The bindings are: type StackedValue() = inherit DataSourceSingleSeries() member x.SetData(data: list<list<'TY>>, chartBinder:ChartBinder<string>) = base.SetDataInternal(seqY data, chartBinder.Chart) member x.SetData(data: list<list<'TX * 'TY>>, chartBinder:ChartBinder<string>) = base.SetDataInternal(seqXY data, chartBinder.Chart) - Anonymous
December 02, 2011
let scatter = [(0.0,0.0)] let line = [(0.0,0.0)] let c = FSharpChart.Combine [ FSharpChart.Point(scatter) FSharpChart.Line (line) ] let cd = ChartData.StackedValue() cd.BindSeries(c.Chart.Series)If I try to use StackedValue this way then I get an error for BindSeries. The error is:"Binding multiple series to a data source object that supports only a single series" - Anonymous
December 06, 2011
The comment has been removed - Anonymous
December 13, 2011
Thanks Carl,I think it will be useful to 'overlay' some types of charts. For example, in machine learning you have raw data and a hypothesis function to fit the data. I would be useful to see both plotted together so that you can monitor how the 'learning' is progressing over time. I think Sho allows something like this but I would rather use FSharpChart.Please consider it as a feature request for your next set of enhancements. - Anonymous
December 14, 2011
Have you looked at Combined Charts. There are a few samples in the sample script and WinForms code. - Anonymous
December 18, 2011
The comment has been removed - Anonymous
December 25, 2011
The comment has been removed


