Analyzing Windows Azure Storage Logs
A few weeks ago, I wrote a post that described how to maximize throughput between HDInsight clusters and Windows Azure Storage. One of the suggestions I made was to adjust your HDInsight cluster’s self-throttling mechanism - i.e. tune the fs.azure.selfthrottling.read/write.factor parameters. I also suggested that the best way to find the optimal parameter values was ultimately to turn on storage account logging and analyze the logs after you had run a job or two. This post describes how to use a new command-line tool (available as part of the .NET SDK for Hadoop) that makes analysis of storage account logs easy.
Here is a summary of the steps to follow for analyzing your storage logs:
- Install the Windows Azure HDInsight Log Analysis Toolkit.
- Turn on logging for your storage account.
- Run a Hadoop job. (I’ll run the 10GB GraySort sample in my example below.)
- Download your storage logs using the Log Analysis Tool (LAT).
- Analyze your storage logs using the LAT.
Read on for details about each step…
Install the Log Analysis Tool (LAT)
Download and run the .msi installer here: Windows Azure HDInsight Log Analysis Toolkit. The .msi will install the toolkit in the C:\Program Files (x86)\Windows Azure HDInsight Log Analysis Toolkit\ directory. The lat.exe will not be added to your Path environment variable by default.
Turn on Storage Account Logging
You can get detailed information about successful and failed requests to your storage account by turning on storage account logging. To do this, follow the instructions here. (For general information about storage analytics, see About Storage Analytics Logging.)
Run a job
For example purposes, I’ll run the 10GB GraySort sample. The jars for this sample are already in place when you provision an HDInsight cluster. The instructions for running this sample are here: The 10GB GraySort Sample. The PowerShell code I used to submit the job is below. A few things to note:
- As one of the arguments for the “teragen” job, I have “1000000000” instead of “100000000” as is used in the documentation. This is to increase the amount of data generated, sorted, and validated. This is a more realistic example.
- I submitted this job to a 16-node HDInsight cluster. Clusters with fewer nodes are not likely to run into throttling by Windows Azure Storage as they simply cannot produce enough throughput to go beyond the storage throttling limits.
- I am manually setting the cluster’s self-throttling factors to “1.0”, which essentially turns self-throttling off. My intention is to produce some level of throttling by Azure Storage for the purposes of this blog post.
 $clusterName = "bswandemo"

 #-----------TERAGEN------------------
 $teragenJob = New-AzureHDInsightMapReduceJobDefinition `
     -JobName "teragenJob" `
     -JarFile "wasb:///example/jars/hadoop-examples.jar" `
     -ClassName "teragen" `
     –Arguments "-Dmapred.map.tasks=50", "1000000000", "wasb:///example/data/10GB-sort-input" `
     -Defines @{"fs.azure.selfthrottling.write.factor" = "1.0"}

 $teragenJob | Start-AzureHDInsightJob -Cluster $clusterName `
             | Wait-AzureHDInsightJob

 #----------TERASORT-------------------
 $terasortJob = New-AzureHDInsightMapReduceJobDefinition `
     -JobName "terasortjob" `
     -JarFile “/example/jars/hadoop-examples.jar” `
     -ClassName "terasort" `
     –Arguments "-Dmapred.map.tasks=50", “-Dmapred.reduce.tasks=25”, “wasb:///example/data/10GB-sort-input”, “wasb:///example/data/10GB-sort-output”

 $terasortJob | Start-AzureHDInsightJob -Cluster $clusterName `
              | Wait-AzureHDInsightJob

 #----------TERAVALIDATE----------------
 $teravalidateJob = New-AzureHDInsightMapReduceJobDefinition `
     -JarFile “/example/jars/hadoop-examples.jar” `
     -ClassName "teravalidate" `
     –Arguments "-Dmapred.map.tasks=50", “-Dmapred.reduce.tasks=25”, “wasb:///example/data/10GB-sort-output”, “wasb:///example/data/10GB-sort-validate” `
     -Defines @{"fs.azure.selfthrottling.read.factor" = "1.0"}

 $teravalidateJob | Start-AzureHDInsightJob -Cluster $clusterName `
                  | Wait-AzureHDInsightJob
Download Storage Logs
Use the Log Analysis Tool (LAT) that you downloaded as part of the .NET SDK for Hadoop to download the storage logs that generated when you ran the job above. (Note that you will have to wait up to 10 minutes for the logs to be generated before you can download them.) To use the download utility, you need 5 pieces of information:
- -start: The start time of the job.
- -end: The end time of the job.
- -logcache: The directory to which the logs will be downloaded.
- -account: Your storage account name (e.g. bswanstorage).
- -key: Your storage account key.
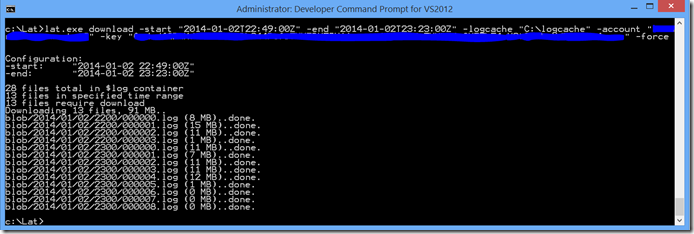
With that information, you can run a command similar to this one (the -force option is only necessary if the log cache directory doesn't exist):
lat.exe download -start "2014-01-02T22:49:00Z" -end "2014-01-02T23:23:00Z" -logcache "C:\logcache" -account "Your account name" -key "Your account key" -force
Here’s the output:
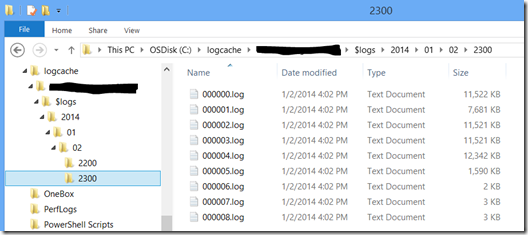
Navigating to my c:\logcache directory, I see the downloaded files:
Analyze Storage Logs
The next step is to analyze the storage logs. To do this, you again need 5 pieces of information (the 6th is optional):
- -logcache: The folder you specified when downloading your storage logs.
- -account: The name of your storage account.
- -start: The start time of the job.
- -end: The end time of the job.
- -name: The name of the job. This name will be used as part of the name of the file to which the storage analyses are written.
- -note: (Optional) This is a note about the job being analyzed.
With this information, you can execute a command similar to this:
lat.exe throttlinganalysis -logcache "C:\logcache" -account "Your storage account name" -start "2014-01-02T22:49:00Z" -end "2014-01-02T23:23:00Z" -name "teragen3" -note "throttling factor set to 1, 16 node cluster"
Here’s the output from the command line:
The analysis is written to two .csv files: jobname.summary.csv and jobname.details.csv (teragen3.summary.csv and teragen3.details.csv in my case). The summary file will contain information similar to this:
We can see from the summary that some throttling did occur in my case. To get a better idea of when the throttling occurred, we need to look at the details file, which contains information about what happened at each 1-second interval of the job:
What’s nice about the details file is that, because it’s a .csv file, you can use Excel features to create a picture of throughput for your job. To do this, select columns A through G, select INSERT from the main menu, and choose Scatter from the Charts options, and finally, select the Straight Lines option:
You should see a graph similar to this one:
As you can see, Azure Storage throttling occurred during the first job (Teragen) because of a high write load. In this particular example, the peak write loads were around 5Gbps which happens to be the throughput quota for uploads to a geo-replicated storage account. So, this example was straying into the red-zone a little. One solution to prevent the Teragen job from issuing writes to Azure Storage above the quota rate is to adjust fs.azure.selftthrottling.write to produce some self-throttling of storage requests by the Hadoop tasks. Other solutions include increasing storage bandwidth quota, reducing cluster size or reducing the cluster usage for the Teragen job.
Please note that the Log Analysis Tool is still in the “experimental” phase. We’d love to hear your feedback and/or have you contribute to the project.
Thanks.
-Brian


