Accessing Hadoop Logs in HDInsight
One of the questions the HDInsight team sees a lot is a variation of the question “How do I figure out what went wrong when something does go wrong?” If you are familiar with Hadoop, you are probably also familiar with rolling up your sleeves and digging into Hadoop logs to answer this question. However, we’ve found that many folks using HDInsight don’t know that much of the logging information they are accustomed to using is easily available to them for HDInsight clusters. This is a quick post to outline the types of logs that are written to your Azure storage account when you spin up an HDInsight cluster:
- Azure setup logs, Hadoop installation logs, and Hadoop Service logs are written to Azure Table Storage, and
- Task logs are written to Azure Blob Storage for jobs submitted through Templeton.
Read on to find out more.
Logs Written to Windows Azure Table Storage
When you create an HDInsight cluster, three tables are automatically created in Azure Table Storage:
- setuplog: Log of events/exceptions encountered in provisioning/set up of HDInsight VMs.
- hadoopinstalllog: Log of events/exceptions encountered when installing Hadoop on the cluster. This table may be useful in debugging issues related to clusters created with custom parameters.
- hadoopservicelog: Log of events/exceptions recorded by all Hadoop services. This table may be useful in debugging issues related to job failures on HDInsight clusters.
Note: To make these table names unique, the names are in this format: uclusternameDDmonYYYYatHHMMSSssshadoopservicelog.
There are many tools available for accessing data in these tables (e.g. Visual Studio, Azure Storage Explorer, Power Query for Excel). Here, I’ll use Power Query first, then Visual Studio, to explore the hadoopservicelog table. In both cases, I’ll assume you have created an HDInsight cluster.
Using Power Query
I’ll assume you have Power Query installed:
1. Connect to Azure Table Storage from Excel.
2. Right click the hadoopservicelog table in the Navigator pane and select Edit Query.
3. Optional: Delete the Partition Key, Row Key, and Timestamp columns by selecting them, then clicking Remove Columns from the options in the ribbon.
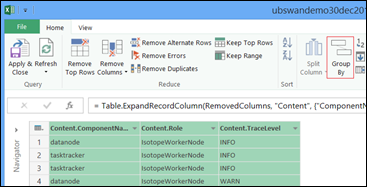
4. Click on the Content column to choose the columns you want to include. For my example, I chose TraceLevel, Role, and ComponentName:
5. Select the TraceLevel, Role, and ComponentName columns, and then click Group By control in the ribbon.
6. Click OK in the Group By dialog box:
7. Finally, click Apply & Close:
You can now use Excel to filter and sort as necessary. Obviously, you may want to include other columns (e.g. Message) in order to drill down into issues when they occur, but selecting and grouping the columns described above provides a decent picture of what is happening with Hadoop services. The same idea can be applied to the setuplog and hadoopinstalllog tables.
Using Visual Studio
1. In Visual Studio, select Server Explorer from the View menu:
2. Expand Windows Azure, right-click Storage, and select Attach External Storage…
3. Provide your storage account name and key.
4. Expand your storage account, expand Tables, and double-click the hadoopservicelog table.
5. Add a filter to exclude rows in which TraceLevel = ‘INFO’ (more info about constructing filters here: Constructing Filter Strings for the Table Designer):
If you are a developer, using Visual Studio provides you the extra level of detail I omitted when using Excel, and you don’t need an “extra” tool.
Logs Written to Windows Azure Blob Storage
The logs written to Windows Azure Tables (as described above) provide one level of insight into what is happening with an HDInsight cluster. However, these tables do not provide task-level logs, which can be helpful in drilling further into issues when they occur. To provide this next level of detail, HDInsight clusters are configured to write task logs to your Blob Storage account for any job that is submitted through Templeton. (Practically, this means jobs submitted using the Windows Azure PowerShell cmdlets or the .NET Job Submission APIs, not jobs submitted through RDP/command-line access to the cluster.) I’ll illustrate how to access these logs by submitting a job and then using CloudXPlorer to view the logs.
Submit a job
I’ll run the WordCount example that is installed with an HDInsight cluster. You can submit this job using either the PowerShell cmdlets or the .NET Job Submission APIs. Note that in each example I set the StatusFolder to “wordcountstatus”. This will be the folder that contains the task logs. Also note that if you use the PowerShell cmdlets, task logs are collected by default. With the .NET job submission APIs, you must set EnableTaskLogs = true to collect task logs.
Powershell cmdlets
 $clusterName = "bswandemo"

 $wordCountJobDef = New-AzureHDInsightMapReduceJobDefinition `
     -JarFile "wasb:///example/jars/hadoop-examples.jar" `
     -ClassName "wordcount" `
     -Arguments "wasb:///example/data/gutenberg/davinci.txt", `
                "wasb:///wordcountoutput"

 $wordCountJob = Start-AzureHDInsightJob `
     -Cluster $clusterName `
     -JobDefinition $wordCountJobDef

 Wait-AzureHDInsightJob `
     -Job $wordCountJob `
     -WaitTimeoutInSeconds 3600

 Get-AzureHDInsightJobOutput `
     -Cluster $clusterName `
     -JobId $wordCountJob.JobId `
     -StandardError
.NET Job Submission APIs
 string clusterName = "bswandemo2";
 var store = new X509Store();
 store.Open(OpenFlags.ReadOnly);
 var cert = store.Certificates.Cast<X509Certificate2>().First(item => item.Thumbprint == "{Thumbprint of certificate}");
 var jobSubmissionCreds = new JobSubmissionCertificateCredential(new Guid("{Your Subscription ID}"), cert, clusterName);
 var jobClient = JobSubmissionClientFactory.Connect(jobSubmissionCreds);

 var MRJob = new MapReduceJobCreateParameters()
 {
     ClassName = "wordcount",
     JobName = "WordCount",
     JarFile = "wasb:///example/jars/hadoop-examples.jar",
     StatusFolder = "wordcountstatus",
     EnableTaskLogs = true
 };
 MRJob.Arguments.Add("wasb:///example/data/gutenberg/davinci.txt");
 MRJob.Arguments.Add("wasb:///wordcountoutput");
 var jobResults = jobClient.CreateMapReduceJob(MRJob);
Note: If you don’t specify a StatusFolder, one will be created for you using a GUID for the folder name.
View logs
After your job completes, you can view the logs using any of the many available tools for viewing Azure Blob Storage. Here, I’m using CloudXplorer. Note that a new folder has been created (templeton-hadoop) for containing job output information. The files in each of the job_ folders contain high-level job completion information (percentComplete, exitValue, userArgs, etc.). However, under the admin folder (under this folder since this was the user who submitted the job), you will find the wordcountstatus (specified at when I submitted the job) that contains task attempt information for each task attempt of the job.
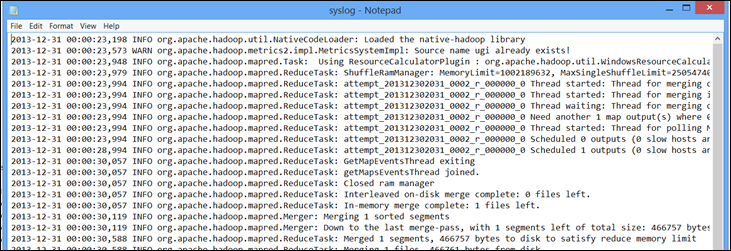
Each of the attempt_ folders contains stderr, stdout, and syslog files. You can drill into these to get a better understanding of if/when something when wrong:
Also note that the job.xml.html file contains all the Hadoop settings that were used when running the job you submitted:
Disabling Logging
Hopefully, you will find the information logged in your Azure storage account to be useful in debugging Hadoop jobs. I do want to point out, however, that because these logs are written to your storage account, you are being billed for storing them. You should create a retention/clean-up policy that is consistent with your development needs to avoid unnecessary charges.
Currently, collection of task logs (the logs written to Blob Storage) is off by default when using the .NET job submission APIs (December update, version 1.0.4.0). To enable it, set EnableTaskLogs = true when defining your job (see the example above). In previous versions, collection of task logs in on by default.
The ability to turn off logging will be available via the PowerShell cmdlets soon.
As always, we’re interested in your feedback on the usefulness of these logs.
Thanks.
-Brian
Comments
- Anonymous
April 21, 2014
The comment has been removed - Anonymous
April 21, 2014
Just realised that the link to my screenshot will not work. This one should though: vqqy6w.bn1303.livefilestore.com/.../20140422_14-26-20%20azureblobstoragelogsforhdi.png - Anonymous
August 04, 2014
This informations is excellent i have to learn to lot of hadoop.Thanks a lot.<a href="http://www.hadooptrainingchennai.co.in">Hadoop Training in Chennai</a> - Anonymous
January 08, 2016
Any details on the ability to turn off logging?


