Comparison Tool released with latest SSMS
Cross post with aka.ms/sqlserverteam
The ability to compare plans is something that a lot of people have to do for troubleshooting reasons. Maybe it’s to find why a query or batch suddenly slowed down; to understand the impact of a rewrite; or observe how a specific performance-enhancing change introduced to the design (like an index) has effectively changed the plan, as these are considerations that drive different choices of the Query Optimizer.
Until now you would open a couple showplans side by side in different SSMS (SQL Server Management Studio) windows, and go through a rather slow and sometimes painful process of finding differences or similarities.
To address that, with the recent release of CTP 2.4, some of you might have noticed something new shipped with SSMS – a Plan Comparison option. The purpose is to provide side-by-side comparison of two different showplans, for easier identification of similarities and changes, that explain the different behaviors for all the reasons stated above, which may include regressions or sudden query performance changes.
So how do I use it?
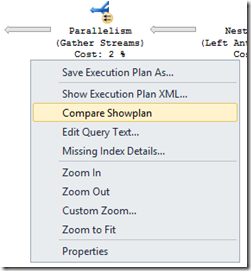
Simply open SSMS, open a query execution plan file (.sqlplan) using File -> Open File, or drag a plan file to SSMS window. Once the file opens, right-click anywhere inside the tab (not necessarily on top of an operator) and select “Compare Showplan”.
Choose the second query plan file that you would like to compare. The second file will open so that you can compare the plans, one on top and one on the bottom. You can toggle them side by side by right-clicking anywhere inside the tab, and selecting “Toggle Splitter Orientation”
If not open yet, access the dual properties window by right clicking anywhere on either showplan, and selecting “Properties”.
And what does it show me?
When two showplans are compared, regions of the plan that do essentially the same thing are highlighted in the same color. Clicking on a colored region in one plan will center the other plan on the matching node in that plan. You can still compare unmatched regions of the showplans, but in that case you have to manually select the operators you want to compare.
Also, instead of the usual properties window, a dual property window grid displays the selected nodes side by side, for easier comparison.
Note that only nodes considered to change the shape of the plan are used to check if sections are equal. Therefore, there may be a node which is not colored in the middle of two nodes that are in the same subsection of the plan. The lack of color in this case implies that the nodes were not considered when checking if the sections are equal.
Humm, show me that.
Let’s see an example to illustrate the tool usage. In this one, we have a query that joins 2 tables, and uses a sub-query on a CTE as a predicate. We are also using OPTION (FAST 100000). After upgrading from SQL 2012 to 2014, we notice a difference in the query performance and need to investigate what changed. We can see below how the matched operator behaves on both executions (bottom one is 70 CE, top is 120 CE), how the plan shape differs substantially and how different estimations were made for the same operation. But it is also important to look at what is unmatched, like how risk_sens table is read, to understand what is different in the overall plan.
Let’s move to a very practical example. Users are complaining that a query that runs to retrieve sales from a date sometimes takes way too long to return results. What does the tool allow us to understand very easily?
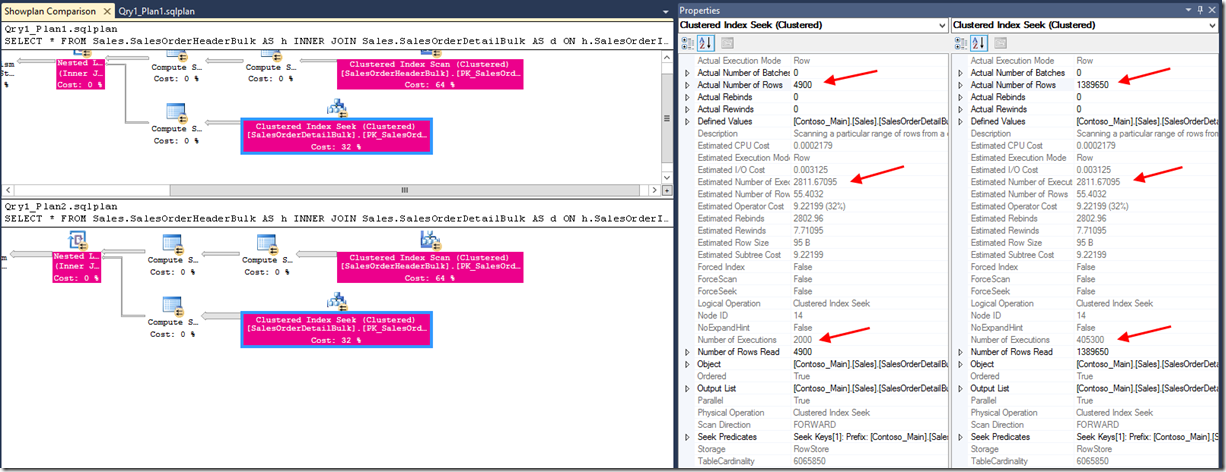
We see large skews between Actual and Estimated number of rows for one of the plans, and that is true for both index operations, as seen below:
Further observation in the SELECT node (below) allows us to verify it is the same plan we are looking at, as seen by the QueryPlanHash. And it becomes clear that the difference in perceived execution time is due to widely varying input parameters, a.k.a. parameter sniffing, causing issues. In this scenario, scans and Merge join on Qry1_Plan2 scenario is the better choice.
And there you have it for now. Expect more of these examples as we continue to develop the tool. To that effect, user feedback is important, and we need that to continue to improve it.
Please use the comment section or better yet, the “Email Blog Author” on the right for that purpose – many thanks in advance for your feedback!
Pedro Lopes (@sqlpto) - Program Manager


