Struggling to get insights for your Azure Data Lake Store? Azure Log Analytics can help!
Customers love to use Azure Data Lake across their organizations by enabling their Data Lake Analytics accounts to use multiple Data Lake Store accounts as data sources. Business can have flexibility with resource usage and allocation, but this creates challenges for the Data Lake account administrators who struggle with understanding what is being used, how often, and by whom. In this blog post I will show you how to obtain several key insights from your Data Lake Store accounts using Azure Log Analytics.
Azure Log Analytics is a powerful solution to track and analyze requests and diagnostics information for multiple Azure services in a single place. If you want to know what types of activities and events are happening in your Data Lake Store account, you can connect your account to Azure Log Analytics to:
- Track all the requests received by the Data Lake Store account.
- Query the logs to identify key insights, such as most active users, total number of jobs submitted, number (and locations) of files opened, and many others.
- Produce reports that seamlessly connect with powerful Microsoft tools, such as PowerBI, based on the Log Analytics queries.
In this blog post, I'll guide you through:
- Connecting your Azure Data Lake Store account to Log Analytics.
- Creating your first Log Analytics query for an Azure Data Lake Store account.
- Identifying which are the most relevant Azure Data Lake Store activities to derive insights.
It's easy to get started working with Azure Data Lake Store and Log Analytics; here is how:
Connect your Azure Data Lake Store account to Log Analytics
Before we can start querying requests submitted to an Azure Data Lake Store account, we need to enable logging these requests to Log Analytics. There is a handy guide on how to enable logging diagnostics and requests on the Azure Data Lake Store documentation . For our purposes we’ll focus on sending Requests logs to a Log Analytics workspace using following steps:
From the ADLS account overview, navigate to Monitoring/Diagnostic Logs, and add a new diagnostics setting (if you already have one set up and you want to re-use it, ensure that it is capturing the Requests log and sending the entries to a Log Analytics workspace).
[caption id="attachment_9395" align="alignnone" width="875"]
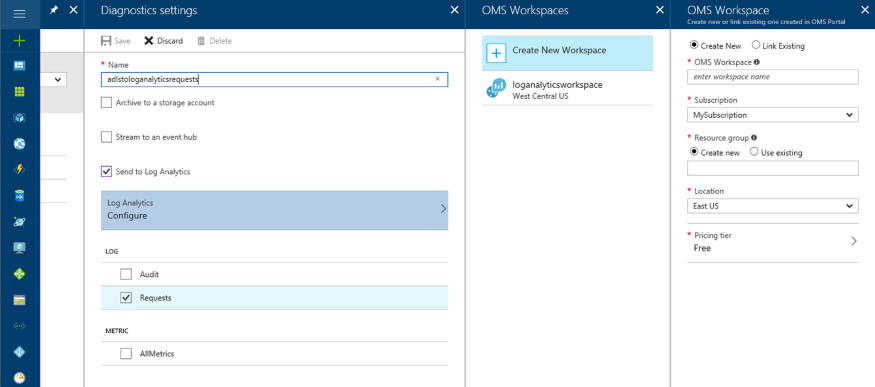 ADLS new diagnostics setting[/caption]
Enter the Diagnostics settings name.
Check the Send to Log Analytics.
Configure the Log Analytics workspace – you can use an existing one or create a new one.
Turn on diagnostics logging for Requests.
[caption id="attachment_9225" align="alignnone" width="500"]
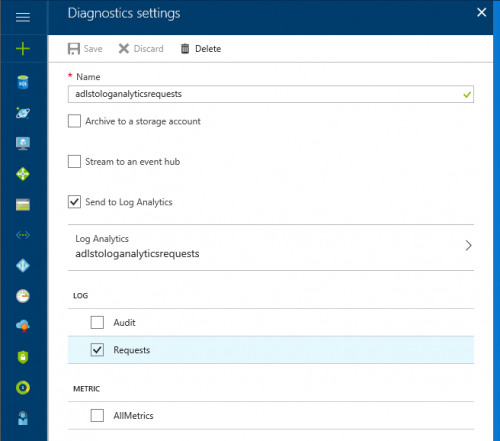 ADLS new diagnostics setting - sending Requests to the selected Log Analytics workspace[/caption]
Save the new Diagnostics settings. Once the set up is complete, a confirmation will appear in the notifications bar, indicating that the Requests log is successfully being sent over to the selected Log Analytics work space.
[caption id="attachment_9305" align="alignnone" width="400"]
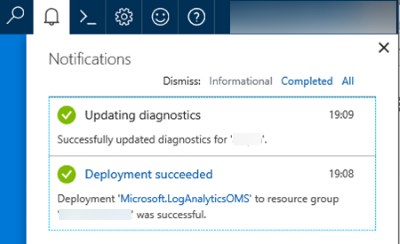 Successful update to send Requests logs to Log Analytics[/caption]
Create your first Log Analytics query for an Azure Data Lake Store account
After you configure the Azure Data Lake Store diagnostics settings to send the Requests log to a Log Analytics workspace, all the operations that are run on the Data Lake Store account create entries that can be queried. This means that you might not have data immediately – as new requests arrive, they will become available in the log.
If you want to run a query immediately, try running a few operations on the Azure Data Lake Store accounts first. These are a few operations you can perform to generate logs:
- Navigate through the directories in the ADLS account.
- Open files
- Rename files
- Delete files
- From Azure Data Lake Analytics, you can submit a simple job, or re-submit an existing one.
Once you have data in your Log Analytics workspace, you can create your first query by following these steps:
Navigate to the Log Analytics service and open the work space that you configured to store your Azure Data Lake Store Requests log
[caption id="attachment_9315" align="alignnone" width="800"]
 Log Analytics work space created in the previous section[/caption]
Navigate to the Log Search section
[caption id="attachment_9325" align="alignnone" width="600"]
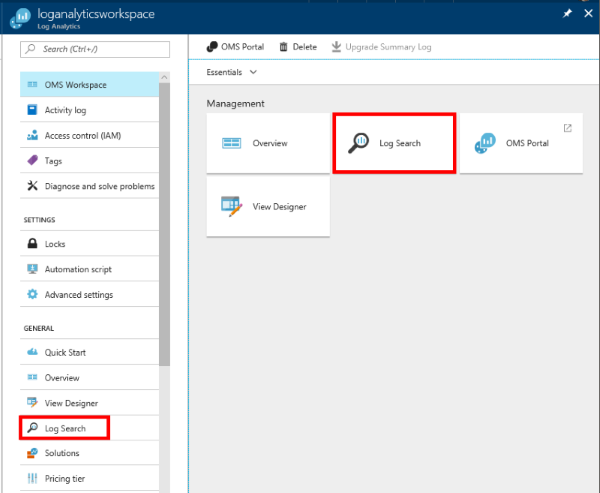 Click the button on the Operations Management Suite Workspace management or on the navigation[/caption]
The first query, will list five requests made to the Azure Data Lake Store account we linked to the Log Analytics work space.
If there is only one account linked to the Log Analytics workspace, use the query below to show five log entries:AzureDiagnostics | where Category == "Requests" | take 5If there are multiple accounts linked to this workspace, you can specify on the query which service and account to target:
 AzureDiagnostics
| where Category == "Requests"
| where ResourceProvider == "MICROSOFT.DATALAKESTORE"
| where Resource == "[Your ADLS Account Name]"
| take 5
Press the magnifying glass button to submit and run the query
[caption id="attachment_9335" align="alignnone" width="800"]
 Log search query results[/caption]
While looking at the results, you can modify the window of time for the results on the left pane. This can help to scope down the log entries returned to those generated at a specific window of time:
[caption id="attachment_9345" align="alignnone" width="446"]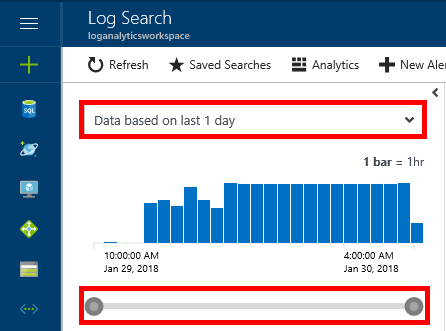 Use the drop down, or the control under the chart to specify a time interval[/caption]
If you want to know more about searching Log Analytics, you can find more information on the Log Analytics documentation. Also, there is a dedicated site for the Log Analytics Query Language if you want to write more complex queries.
Identify which are the most relevant Azure Data Lake Store activities to derive insights from
The actions or OperationName that can be the most useful for understanding activity on the Azure Data Lake Store are the following:
|
|
|
|
|
|
These operations can be used in the queries, such as:
Who has opened files and how many, from the Azure Data Lake Account?
 AzureDiagnostics
| where OperationName == "open"
| where ResultType == 200
| summarize count() by identity_s
[caption id="attachment_9355" align="alignnone" width="729"]
 Number of times a file in the ADLS account has been successfully opened[/caption]
By whom and when in the day is data being opened (read) from the Azure Data Lake Store account?
 AzureDiagnostics
| where OperationName == "open"
| where ResultType == 200
| summarize count(identity_s) by hourofday(TimeGenerated), identity_s
[caption id="attachment_9365" align="alignnone" width="723"]
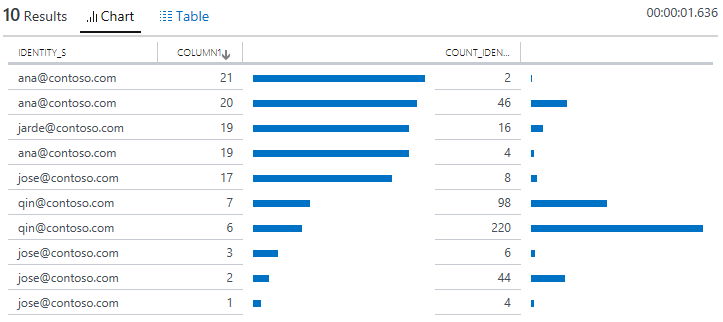 Number of times a file in the ADLS account has been successfully opened by hour of day (column1). [/caption]
Who is opening data in the account and how many times by week of the year?
 AzureDiagnostics
| where OperationName== "open"
| where ResultType == 200
| summarize Occurrences = count(identity_s) by WoY = weekofyear(TimeGenerated), identity_s
| project identity_s, WoY, Occurrences
[caption id="attachment_9375" align="alignnone" width="881"]
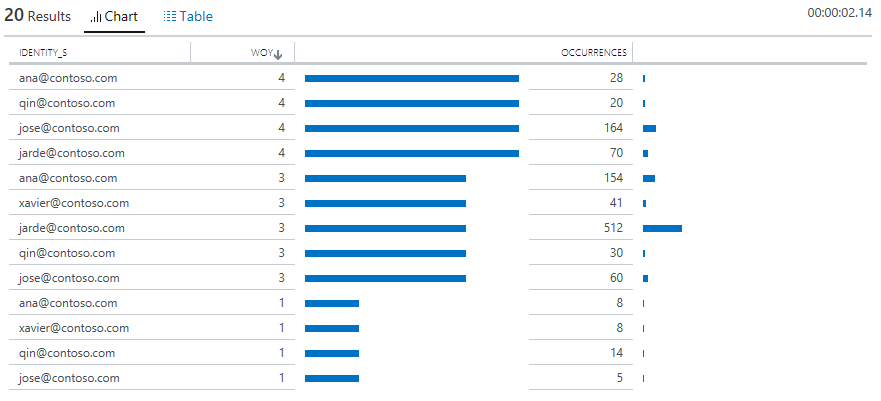 Number of times a file in the ADLS account has been successfully opened by users by week of the year. [/caption]
Wrap up
Azure Data Lake Store can be configured to send many types of logs to Log Analytics. By knowing which operations are logged and how to query them, you can get tremendously valuable insights into your Data Lake Store usage – from who is actively using it, to the frequency of the operations themselves.
As we improve the way to get insights natively from within the Data Lake Store account, we are curious to know what type of information can help you work better -- are looking for specific user actions? Specific trends? Drop us a line on our UserVoice forum or in the comments section!
Go ahead and connect your Data Lake Store account to Log Analytics and start obtaining valuable insights now, it is easy to get started!
Thanks for reading.