Collect AX 2012 event traces with Windows Performance Monitor
Users can collect AX 2012 event traces with the Tracing Cockpit tool (see previous posting), the xClassTrace X++ class or the Windows Performance Monitor. Windows Performance Monitor is commonly used in the scenarios where AX 2012 client is not available, for example, collecting event traces for Enterprise Portal scenarios.
Steps to collect AX 2012 event traces with Windows Performance Monitor:
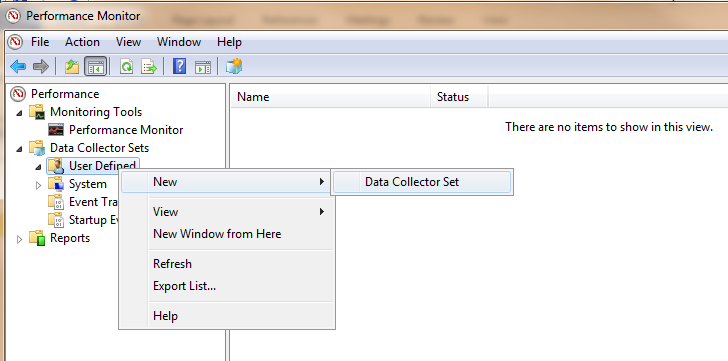
- 1. On a box that runs the AOS instance you want to collect event traces from, start Windows Performance Monitor and add a new User Defined Data Collector Set:
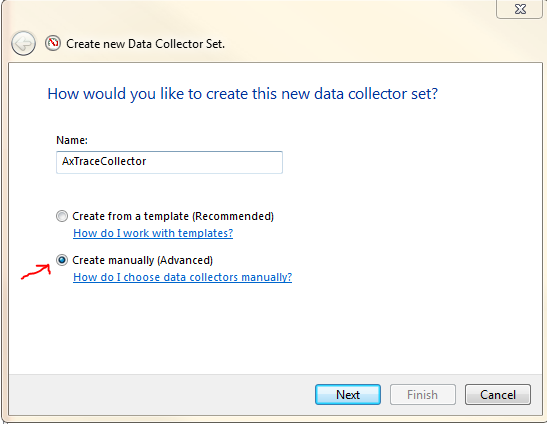
- 2. Give the Data Collector Set a name and select [Create manually] (you will be able to use “Create from a template” once you have a template created after going through the manual steps); click [Next].
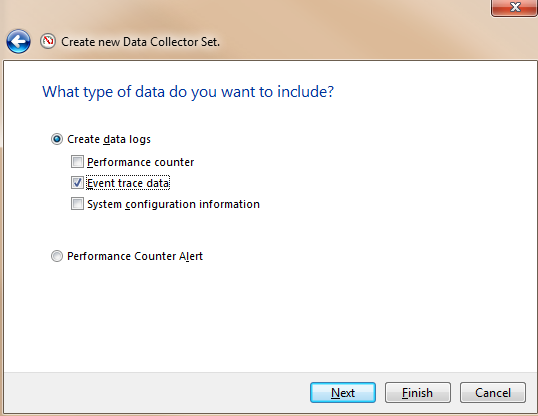
3. Check [Event Trace Data] under [Create Data Logs], and then click the [Next] button.
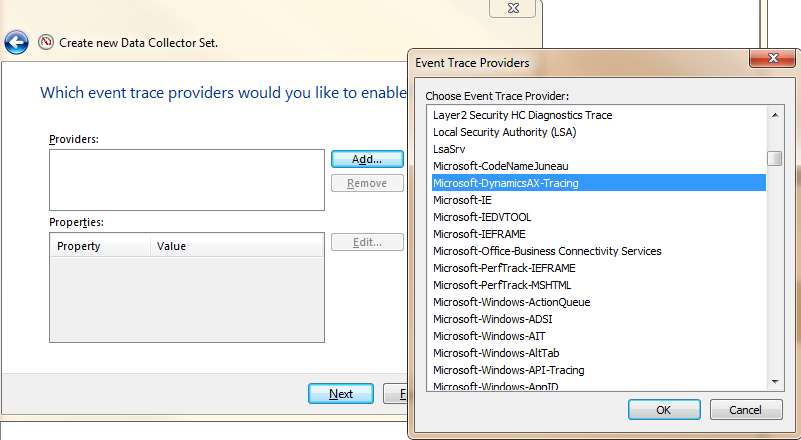
4. In the step “Which Event Trace Provider you like to enable”, click the [Add] button and select “Microsoft-DynamicsAX-Tracing” from the Event Trace Provider list, then click [OK].
- 5. Click the [Edit] button to bring up the Property dialog. Choose the event keywords (categories) that you like to collect:
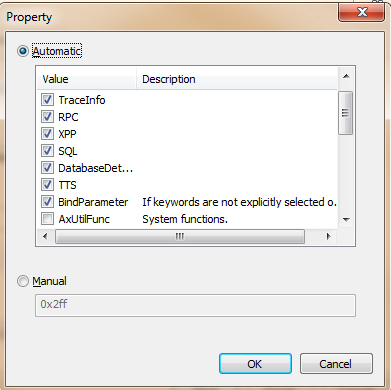
Some keywords in the list are not performance related and selecting them will produce bigger size of trace files that contain irrelevant information. For performance diagnostic with Trace Parser, we recommend you checking the following keywords:
XPPMarker, TraceInfo, RPC XPP, SQL, Database Detailed, TTS, BindParameter and XPPParm.
If BindParameter is selected, the resulting event traces contain bind parameters for all SQL statements; if XPPParm is selected, the resulting event traces contain arguments for all X++ calls. SQL bind parameters and X++ arguments may contain sensitive data such as Personal Identifiable Information (PII), and you should take extra caution to protect these trace files.
(Note that the data collector will collect all types of events if you don’t select any keyword. This is not recommended).
Click the [OK] button.
- 6. Click [Next] and specify a directory for storing trace files.
- 7. In the next step, select [Save and close] and then click the [Finish] button.
- 8. Now you need to modify some settings for the newly created data collector. Right click the “DataCollector01” in the right pane, and then click the [Properties] menu item:

In the Properties window, switch to the [Trace Buffers] tab and modify the default buffer settings. The default buffer setting does not work well for collecting AX event traces where large amount of events could be generated in short time and fill the buffers quickly. We recommend the following settings (leave the rest setting as default):
-
- Buffer Size: 512kB
- Minimum Buffers: 60
- Maximum Buffers: 60
9. Now you can start or stop collecting AX event traces by clicking the start/stop buttons on the tool bar:

9. You may want to save the data collector set as a template and reuse the template on a different box, or share it with other users: Right click the Data Collector Sets and select [Save Template] menu item:

Comments
- Anonymous
December 04, 2011
Very well explained and a very useful post!!! - Anonymous
December 05, 2011
Hi, I wanted to increase my AX 2012 AOS throughput, what are the guides availables to date? Also what do you suggest?Thanks - Anonymous
December 05, 2011
Is there a possibility to a add the event trace provider for AX2009 too?Or is only the trace parser client available for AX2009?Thanks - Anonymous
May 23, 2012
The comment has been removed - Anonymous
May 23, 2012
@Thomas: No, there is no possibility for AX2009, AX itself controls the collection of events. You can automate it by setting the tracestart registry key to '1', but it is nowhere near as nice. - Anonymous
June 28, 2012
Hi to all,@Ray: Thanks for feedback.We have now successfully used the tracing in AX2012. We are currently investigating about a performance problem we have and the trace of AX2012 and Traceparser are very powerfull instruments in such kind of activity.I have a question regarding some information shown in the traceparcer.We have a call through the SysOperationRPCFrameworkSerivce::runServiceOperation --> SysDictClass::invokeStaticMethodIL --> runas(......)Tn the traceparcer the runAs call is shown as ClientEvalFunc, we are on the AOS server, but what does the ClientEvalFunc mean? Will here a roundtrip to the client be done?Our performance problem is that in order to perform the runAs between 20 to 40 seconds are taken, but in the traceparser we don't see what is going on as no other additinal stack trace is shown.Can you please provide some hints?Thanks in advanceThomas - Anonymous
June 29, 2012
The comment has been removed