How to train your MAML – Importing data
In my last post I split the process of using Microsoft Azure Machine Learning (MAML) down to four steps:
- Import the data
- Refine the data
- Build a model
- Put the model into production.
Now I want to go deeper into each of these steps so that you can start to explore and evaluate how this might be useful for your organisation. To get started you’ll need an Azure subscription; you can use the free trial, your organisation’s Azure subscription or the one that you have with MSDN. You then need to sign up for MAML as it’s still in preview (note using MAML does incur charges but if you have MSDN or a trial these are capped so you don’t run up a bill without knowing it)..
You’ll now have an extra icon for MAML in your Azure Management Portal and the from here you’ll need to create an ML Workspace to store your Experiments (models). Here I have one already called HAL but I can create another if I need to by clicking on New at the bottom of the page, and selecting Machine Learning and clicking on it and then following the Quick Create wizard..
Notice that as well as declaring the name and owner I also have to specify a storage account where my experiments will reside and at the moment this service is only available in Microsoft’s South Central US data centre. Now I have somewhere to work I can launch ML Studio from the link on the Dashboard..
This is simply another browser based app which works just fine in modern browsers like Internet Explorer and Chrome..
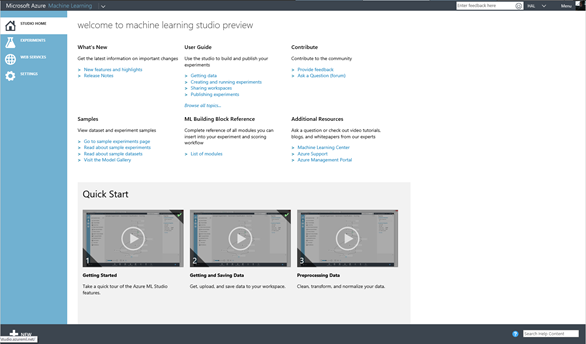
There’s a lot of help on the home page from tutorials and sample to a complete list of functions and tasks in the tool. However this seems to be aimed at experienced data scientists who are already familiar with the concepts of machine learning. I am not one of those but I think this stuff is really interesting so if this all new to you too then I hope my journey through this will be useful but I won’t be offended if you break off now and check these resources because you went to University and not to Art College like me!
In my example we are going to look at predicting flight delays in the US based on one of the included data sets. There is an example experiment for this but there isn’t an underlying explanation on how to build up a model like this so I am going to try and do that for you. The New option on the bottom of this ML studio screen allows you to create a new experiment and if you click on this you are presented with the actual ML studio design environment..
ML studio works much like Visio or SQL Server Integration Services, you just drag and drop the boxes you want on the design surface and connect them up but what do we need to get started?
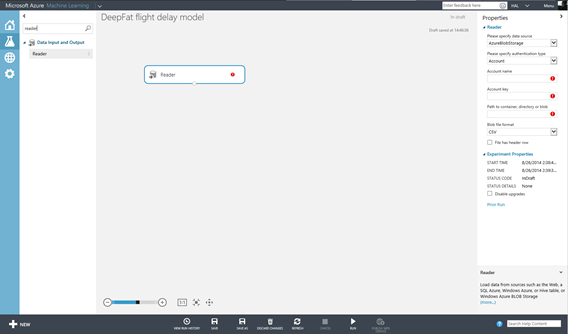
MAML needs data and there are two places we can import this - either by performing a data read operation from some source or creating a data set or. At this point you’ll realise there’s lots of options in ML Studio and so the search option is a quick way of getting to the right thing if you know it’s there. If we type reader into the search box we can drag that onto the design surface to see what it does..
The Reader module comes up with a red x as it’s not configured, and to do that there a list of properties on the right hand side of the screen. For example if the data we want to use is in Azure blob storage then we can enter the path and credentials to load that in. There are also options for http feed , SQL Azure, Azure Table Storage as well as HiveQuery (to access Hadoop and HDInsight) and PowerQuery. PowerQuery is a bit misleading as it’s actually a way of getting OData and one example of that is PowerQuery. Having looked at this we’ll delete it and work with one of the sample data sets.
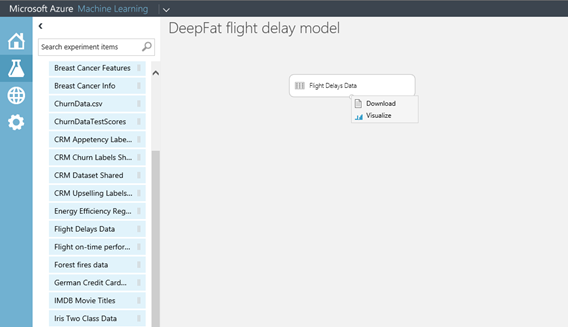
Expand the data sources option on the left you’ll see a long list of samples from IMDB film titles to flight delays and astronomy data. If I drag the Flight Delays Data dataset onto the design surface I can then examine it by right clicking on the output node at the bottom of it, right click and select Visualize..
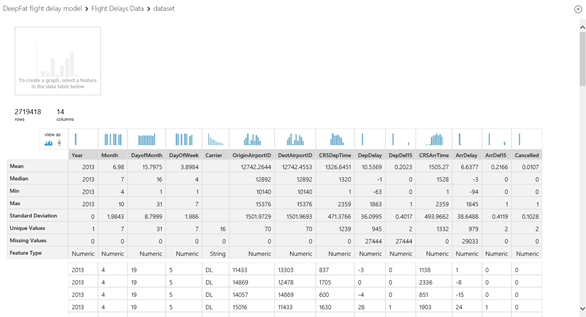
this is essential as we need to know what we are dealing with and ML Studio gives us some basic stats on what we have..
MAML is fussy about it’s diet and heres’ a few basic rules:
- we just need the data we that are relevant to making a prediction. For example all the rows have the same values for year (2013) so we can exclude that.
- There shouldn't be any missing values in the data we are going to use to make a prediction and 27444 rows of this 2719418 row data set have missing departure values so we will want to exclude those.
- No feature should be dependant on another feature much as in good normalisation techniques for data base design. DepDelay and DepDel15 are related in that if DepDelay is greater then 15 minutes then DepDelay = 1. The question is which one is the best at predicting the Arrival Delay, specifically ArrDel15 which is whether or not the flight is more than 15 minutes late.
- Each column (feature in data science speak) should be of the same order of magnitude.
However eve after cleaning this up there is also some key missing data to answer our question “why are flights delayed?” It might be problems associated with the time of day or the week , the carrier our difficulties at the departing or arriving airport, but what about the weather which isn’t in our data set? Fortunately there is another data set we can use for this – the appropriately named Weather dataset. If we examine this in the same way we can see that it is for the same time period and has a feature for airport so it's be easy to join to our flight delay dataset. The bad news is that most of the data we want to work with is of type string (like the temperatures) and there redundancy ion it as well so we’ll have some clearing up to do before we can use it.
Thinking about my flying experiences it occurred to me that we might need to work the weather dataset in twice to get the conditions at both the departing and the arriving airport. Then I realised that any delays at the departing airport might be dependant on the weather and we already have data for the departure delay (DepDelay) so all we would need to do is to join it which we’ll look at in the next post in this series where we prepare the data. based on what we know about it.
Now we know more about our data we can start to clean it and refine it and I’ll get stuck into that in my next post but just one thing before I go – we can’t save our experiment yet as we haven’t got any modules on there to do any processing so don’t panic we’ll get to that next.


