WCF End-To-End Tracing
I have to say WCF tracing is quite well documented in MSDN and even though this is certainly an aspect developers could take advantage of, sometimes you can get discouraged if facing tons of documents, technical details, etc. As a consequence you end up to ignore even the fundamental topics. My aim is to provide the main WCF tracing concepts in order to prevent you get disoriented in front of any WCF trace and take advantage of its powerful features.
Let’s begin from the basics. From MSDN, we have:
- Activities: “are processing units that help the user narrow down the scope of a failure. Errors that occur in the same activity are directly related.”
- Transfer: “Transfers between activities represent causal relationships between events in the related activities within endpoints. Two activities are related with transfers when control flows between these activities, e.g., a method call crossing activity boundaries.” In plain words, we can see transfers like relationships between activities.
- Propagation: “Propagation provides the user with direct correlation of error traces for the same unit of processing across application endpoints, e.g., a request. Errors emitted at different endpoints for the same unit of processing are grouped in the same activity, even across application domains.”
You need to get the definitions above quite clear in your mind, so let’s have a look at a sample: I’ve used the WsHttpBinding CalculatorService sample. Here’s the service interface:
 [ServiceContract(Namespace = "https://Microsoft.ServiceModel.Samples")]
public interface ICalculator
{
    [OperationContract]
    double Add(double n1, double n2);
    [OperationContract]
    double Subtract(double n1, double n2);
    [OperationContract]
    double Multiply(double n1, double n2);
    [OperationContract]
    double Divide(double n1, double n2);
}
And this is the web.config part for the service configuration:
 <system.diagnostics>
    <sources>
      <source name="System.ServiceModel"
              switchValue="Information, ActivityTracing"
              propagateActivity="true" >
        <listeners>
          <add name="xml"/>
        </listeners>
      </source>
      <source name="System.ServiceModel.MessageLogging">
        <listeners>
          <add name="xml"/>
        </listeners>
      </source>
    </sources>
    <sharedListeners>
      <add name="xml"
           type="System.Diagnostics.XmlWriterTraceListener"
                 initializeData="C:\\Users\\andreal\\Documents\\Workshop WCF\\WS\\Http\\Client\\bin\\Debug\\SRV_Traces.svclog" />
    </sharedListeners>
  </system.diagnostics>

  <system.serviceModel>
    <services>
      <service behaviorConfiguration="Service.ServiceBehavior" name="Microsoft.ServiceModel.Samples.CalculatorService">
          <endpoint address="" binding="wsHttpBinding" contract="Microsoft.ServiceModel.Samples.ICalculator" >
          <identity>
            <dns value="localhost" />
          </identity>
        </endpoint>
        <endpoint address="mex" binding="mexHttpBinding" contract="IMetadataExchange" />
      </service>
    </services>
    <behaviors>
      <serviceBehaviors>
        <behavior name="Service.ServiceBehavior">
          <!-- To avoid disclosing metadata information, set the value below to false and remove the metadata endpoint above before deployment -->
          <serviceMetadata httpGetEnabled="true"/>
          <!-- To receive exception details in faults for debugging purposes, set the value below to true.  Set to false before deployment to avoid disclosing exception information -->
          <serviceDebug includeExceptionDetailInFaults="false"/>
        </behavior>
      </serviceBehaviors>
    </behaviors>

    <diagnostics wmiProviderEnabled="true">
      <messageLogging
           logEntireMessage="true"
           logMalformedMessages="true"
           logMessagesAtServiceLevel="true"
           logMessagesAtTransportLevel="true"
           maxMessagesToLog="3000"
       />
    </diagnostics>

  </system.serviceModel>
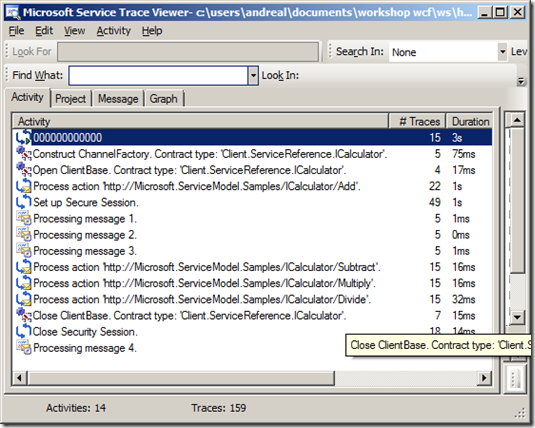
The WCF client simply calls the four methods one by one and it’s configured to emit traces exactly like the service does. If you open the client traces with Microsoft Service Trace Viewer a windows like this will appear:
As you can see, we have 14 activities: {00000000-0000-0000-0000-000000000000} is the root activity, that is the default activity: all the other 13 activities transfer out of 0. A very powerful feature is the propagateActivity: if propagateActivity is set to true on both the client and service configuration, this activity has the same id as the one defined in the client, and described previously. From this stage we start to benefit from direct correlation across endpoints, because all traces emitted in WCF that are related to the request are in that same activity, including the response message processing. I recommend to read this very good MSDN article: Using Service Trace Viewer for Viewing Correlated Traces and Troubleshooting.
Everything seems well documented so far and you could start wondering why I wrote this post. One day a customer came out with this need:
”We decided to implement our own logging for business purposes, but needed a way to correlate messages through a chain of services. […] What fails is adding another layer of services. The incoming GUID must be passed to the outgoing header of the new request.”
You can easily correlate a C client with a S service, but what if you have C, S1, S2, Sn and need to correlate the message flow through the whole chain? I’m going to explain the solution I thought (that got the customer quite satisfied) with a sample (I think samples always make things easier).
I’ve changed the Extended Tracing sample (from https://msdn.microsoft.com/en-us/library/aa354511.aspx) introducing a “middle-tier” service. The sample produces some custom traces according to https://msdn.microsoft.com/en-us/library/aa738759.aspx. The interface is the well known ICalculator, used in most of our samples.
So I made 3 projects: a client console application, a self-hosted WCF service named Service1 which in turns calls another WCF Service named Service2.
The client generates a global activity id (calculator) and one activity id for each operation. The operation activity identifiers are propagated to Service1, which in turn send them to Service 2.
 [...]
TraceSource ts = new TraceSource("ClientCalculatorTraceSource");

 // Start the calculator activity
 Guid newGuid = Guid.NewGuid();
 Trace.CorrelationManager.ActivityId = newGuid;
 ts.TraceEvent(TraceEventType.Start, 0, "Calculator Activity");

 // Create a proxy with given client endpoint configuration
 using (CalculatorProxy proxy = new CalculatorProxy())
 {
     // Save the calculator activity id to transfer back and forth from/to it
     Guid originalGuid = Trace.CorrelationManager.ActivityId;

     // Create and start the Add activity
     // Generate a new activity id
     newGuid = Guid.NewGuid();
     // Transfer from the calculator activity to the new (Add) activity
     // The value for the "from" in the tranfer is implicit; it is the activity id
     // previously set in Trace.CorrelationManager.ActivityId
     // The value for the "to" is explicitly passed as the newGuid parameter
     ts.TraceTransfer(0, "Transferring...", newGuid);
     // Set the new activity id in Trace.CorrelationManager.ActivityId; it is now in scope
     // for subsequently emitted traces
     Trace.CorrelationManager.ActivityId = newGuid;
     // Emit the Start trace for the new activity
     ts.TraceEvent(TraceEventType.Start, 0, "Add Activity");

     // Now make the Add request
     double value1 = 100.00D;
     double value2 = 15.99D;
     ts.TraceEvent(TraceEventType.Information, 0,
         "Client sends Add request message.");
     double result = proxy.Add(value1, value2);

     // Trace that you have received the response
     ts.TraceEvent(TraceEventType.Information, 0,
         "Client receives Add response message.");
     Console.WriteLine("Add({0},{1}) = {2}", value1, value2, result);

     // Transfer back to the Calculator activity and stop the current activity
     ts.TraceTransfer(667, "Transferring...", originalGuid);
     ts.TraceEvent(TraceEventType.Stop, 0, "Add Activity");

     // Set the calculator activity back in scope
     Trace.CorrelationManager.ActivityId = originalGuid;

[...]
 }

 ts.TraceEvent(TraceEventType.Stop, 0, "Calculator Activity");
[...]
Client,Service1 and Service2 define their own trace sources, each one writes an XML log on file system.
 public double Add(double n1, double n2)
 {
     if (Trace.CorrelationManager.ActivityId == Guid.Empty)
     {
         Guid newGuid = Guid.NewGuid();
         Trace.CorrelationManager.ActivityId = newGuid;
     }

     ts.TraceEvent(TraceEventType.Start, 0, "Add Activity");
     ts.TraceEvent(TraceEventType.Information, 0, "Service1 receives Add request message. Args: {0}, {1}", n1, n2);

     ts.TraceEvent(TraceEventType.Information, 0, "Service1 sends Add request message. Args: {0}, {1}", n1, n2);

     Microsoft.ServiceModel.Samples.Client.CalculatorProxy proxy = new Microsoft.ServiceModel.Samples.Client.CalculatorProxy();
     double result = proxy.Add(n1, n1);
     proxy.Close();

     // Trace that you have received the response
     ts.TraceEvent(TraceEventType.Information, 0, "Service1 receives Add response message. Result: {0}", result);
     Console.WriteLine("Add({0},{1}) = {2}", n1, n1, result);

     //double result = n1 + n2;

     ts.TraceEvent(TraceEventType.Information, 0, "Service1 sends Add response message. Result: {0}", result);
     ts.TraceEvent(TraceEventType.Stop, 0, "Add Activity");

     return result;
 }
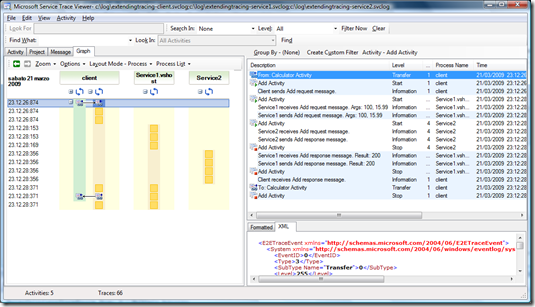
If you run a test and then open the trace files with the Service Trace Viewer, you will be able to see the activities correlated through the activity ids being propagated as expected.
Defining your own trace sources allows you to just enable the needed information tracing, discarding other WCF stuff (please notice the config files).
Of course this is just a sample, and it’s waiting for being improved by anyone of you! Bye for now!
Andrea
Comments
- Anonymous
March 21, 2009
PingBack from http://blog.a-foton.ru/index.php/2009/03/22/wcf-end-to-end-tracing/ - Anonymous
March 21, 2009
I'm putting together a toolkit in one of my Codeplex projects that contains activity tracing functionality. It takes care of all the activity tracing plumbing for you.http://neovolve.codeplex.com/SourceControl/changeset/view/30170#372001It would essentially allow you to rewrite your add method like this:public double Add(double n1, double n2){ using (ActivityTrace activity = new ActivityTrace()) { activity.WriteInformation("Service1 receives Add request message. Args: {0}, {1}", n1, n2); activity.WriteInformation("Service1 sends Add request message. Args: {0}, {1}", n1, n2); Microsoft.ServiceModel.Samples.Client.CalculatorProxy proxy = new Microsoft.ServiceModel.Samples.Client.CalculatorProxy(); double result = proxy.Add(n1, n1); proxy.Close(); // Trace that you have received the response activity.WriteInformation("Service1 receives Add response message. Result: {0}", result); Console.WriteLine("Add({0},{1}) = {2}", n1, n1, result); //double result = n1 + n2; activity.WriteInformation("Service1 sends Add response message. Result: {0}", result); return result; }} - Anonymous
March 25, 2009
Hello Rory, a very interesting initiative.Thanks for your contribute! - Anonymous
November 15, 2012
A complete sample is here: www.dotnetcodecentral.com/.../trace-log-messages-from-end-to-end-using-wcf-and-a-clientCan any one help me to do the same using WCF REST/Data Services (OData)

