Note
Access to this page requires authorization. You can try signing in or changing directories.
Access to this page requires authorization. You can try changing directories.
Before you start debugging make sure you have the symbols path set appropriately. Below link shows you how to configure symbol path
https://blogs.msdn.com/johan/archive/2007/11/13/getting-started-with-windbg-part-i.aspx
Once you have the right dump with you open the crash dump through windbg and load sos.dll using the command .load sos. Windbg by default will show the native stack and for you to look into managed stack sos.dll is required to be loaded.
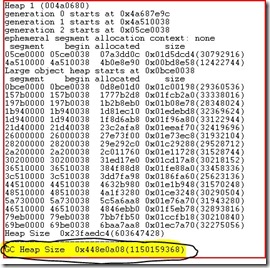
The next thing I need to determine is whether the leak is in managed heap or unmanaged heap. Type in the command !eeheap -gc.
As you can see in the above snapshot, out of the total dump size of 1.2 GB, the GC heap size is 1.15 GB which clearly indicates the leak is in managed code.
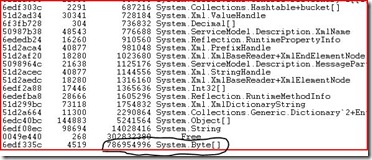
Now I do a !dumpheap -stat to give the overall summary of space usage of .NET objects. This shows System.Byte[] to be the largest consumer of memory(786 MB) as shown below.
Lets try to dump some of the System.Byte[] objects using !dumpheap -type System.Byte[] to get the object addresses. Next thing we need to determine is what is causing this objects to stay alive and not get garbage collected in other words we need to find out the references of these objects. Run the !gcroot <address> command on one of the System.Byte[] objects consuming highest memory.
I checked the code and the only suspect here looked like OperationContextScope. This class implemented the idisposable interface and was instantiated several times in the code and never being disposed off. To confirm that OperationContextScope was indeed the culprit I tried to figure out the total memory usage of this object. In order to do that you need to get the methodtable address of it. Use the command !name2ee <assemblyname> <Object>. In this case I typed in
!name2ee System.ServiceModel.dll System.ServiceModel.OperationContextScope
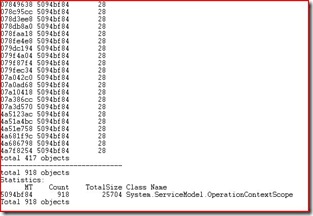
A method table contains all the objects instances of a particular type(OperationContextScope), so the next i did was to dump the method table to get all the object addresses for OperationContextScope.
Type in !dumpheap -mt 5094bf84
I tried to find the size of some of the objects using !objsize <address> and found that they were in the range of 20-60 MB and they totalled upto 750 MB and there were many more smaller objects still alive. This confirmed that OperationContextScope object was indeed the cause of OutOfMemoryException and needs to be disposed as soon as it is done using with.
Comments
- Anonymous
December 16, 2008
The comment has been removed - Anonymous
December 18, 2008
Web 10 Ways to Cut Down Web Development Time JavaScript Inheritance via Prototypes and Closures How to - Anonymous
December 18, 2008
Web10WaystoCutDownWebDevelopmentTimeJavaScriptInheritanceviaPrototypesandClosu...


