Use Process Explorer To Quickly Identify Performance Bottlenecks In ASP.NET Web Applications
| |
 by
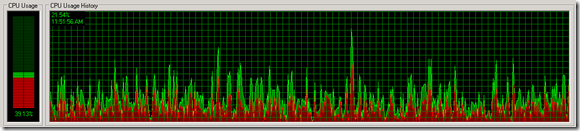
by CPU Usage History
This view helps to spot "unusual" activity for ASP.NET Web Application. When I see "too much" red color in this view I start asking question "Why Managed .Net Code performs privileged operations?" From my observations it mostly caused by excessive usage of threading.
- Pitfalls With .Net Multithreading And COM Objects – Threads Must Have Compatible Apartment Models (MTA vs. STA)
- Improve ASP.NET 2.0 Performance With PageAsyncTask - Multithreading For The Masses
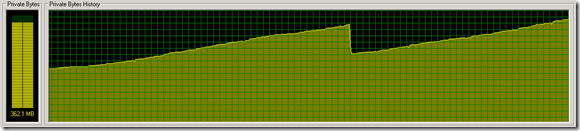
Private Bytes Memory
This view has become my favorite recently as I was involved in few cases with memory leakage. I think the picture is self explanatory.
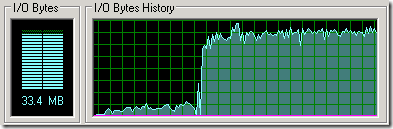
I/O Bytes History
This view helps me spotting potential I/O bottlenecks.
- Performance Sin - Chatty Database Access And Loops (Plus Another Free Performance Tool)
- ASP.NET Performance Sin - Serving Images Dynamically (Or Another Reason To Love Fiddler)
This post is made with PracticeThis.com plugin for Windows Live Writer