Azure App Service
Azure App Service is a service used to create and deploy scalable, mission-critical web apps.
8,493 questions
This browser is no longer supported.
Upgrade to Microsoft Edge to take advantage of the latest features, security updates, and technical support.
' cx='32' cy='32' r='32' /%3E%3Ctext x='50%25' y='55%25' dominant-baseline='middle' text-anchor='middle' fill='%23FFF' %3ES%3C/text%3E%3C/svg%3E)
Hello!
I've created a Resource Group with an App Service Linux (Production plan) and a MySQL Database.
I've uploaded and configured Wordpress on this app service. Everything was working fine but in last month I've found my web app with an error page twice.
The error page was only reporting "Server Error".
I've searched errors through logs (docker and mysql) but I did not find interesting rows. The only one was::
PHP Warning: Error while sending QUERY packet. PID=2696 in /home/site/wwwroot/wp-includes/wp-db.php on line 2030, referer: https://www.google.com/
I don't know why it is referring to google.com. Trying to find a reason for the error I've also uploaded a static HTML file and server keeps returning the error page and obviously I've tried to restart the App Service.
The only action that solved the problem was scale up to a better plan. I've investigated why and I've noticed the memory usage jumped to the max memory available even if request to the site are following the average number of requests in last month, where memory usage was quite lower. For example, 3.5GB was the memory usage when App Service was down, 500 MB is the average memory usage in past 20 days.
Anyway, the site started immediately when I scaled up the service.
Why memory started to be critical even if I did not changed anything on my web site? Is it possible tha Docker container is not working fine? Or how can I manage this problem without having my website down?
Thanks
' cx='32' cy='32' r='32' /%3E%3Ctext x='50%25' y='55%25' dominant-baseline='middle' text-anchor='middle' fill='%23FFF' %3ESM%3C/text%3E%3C/svg%3E)
You may refer to this doc for troubleshooting high memory issue might be helpful, In case issue persist please send an email to AzCommunity[at]Microsoft[dot]com referencing this issue.
Thanks for asking question! If you are experiencing high memory usage in your web app the few questions scoping here is: Where are you seeing high memory? Is it low physical memory or low available memory on the instance or high Private bytes for worker process? Number of sites \ slots \ webjobs are running in which App Service Plan and size of instance.
You may look into memory usage pattern. Is memory constantly increasing and not reducing or the memory reaches a stage (say 2 or 3GB) and it stays there. Memory constantly increasing and not decreasing could be a memory leak and “memory reaches a particular stage (say 2 or 3GB)” might indicate caching etc.
There is the new diagnostics experience to help you drill down memory usage on each instance serving your app and to identify the app and the corresponding process causing High Memory.
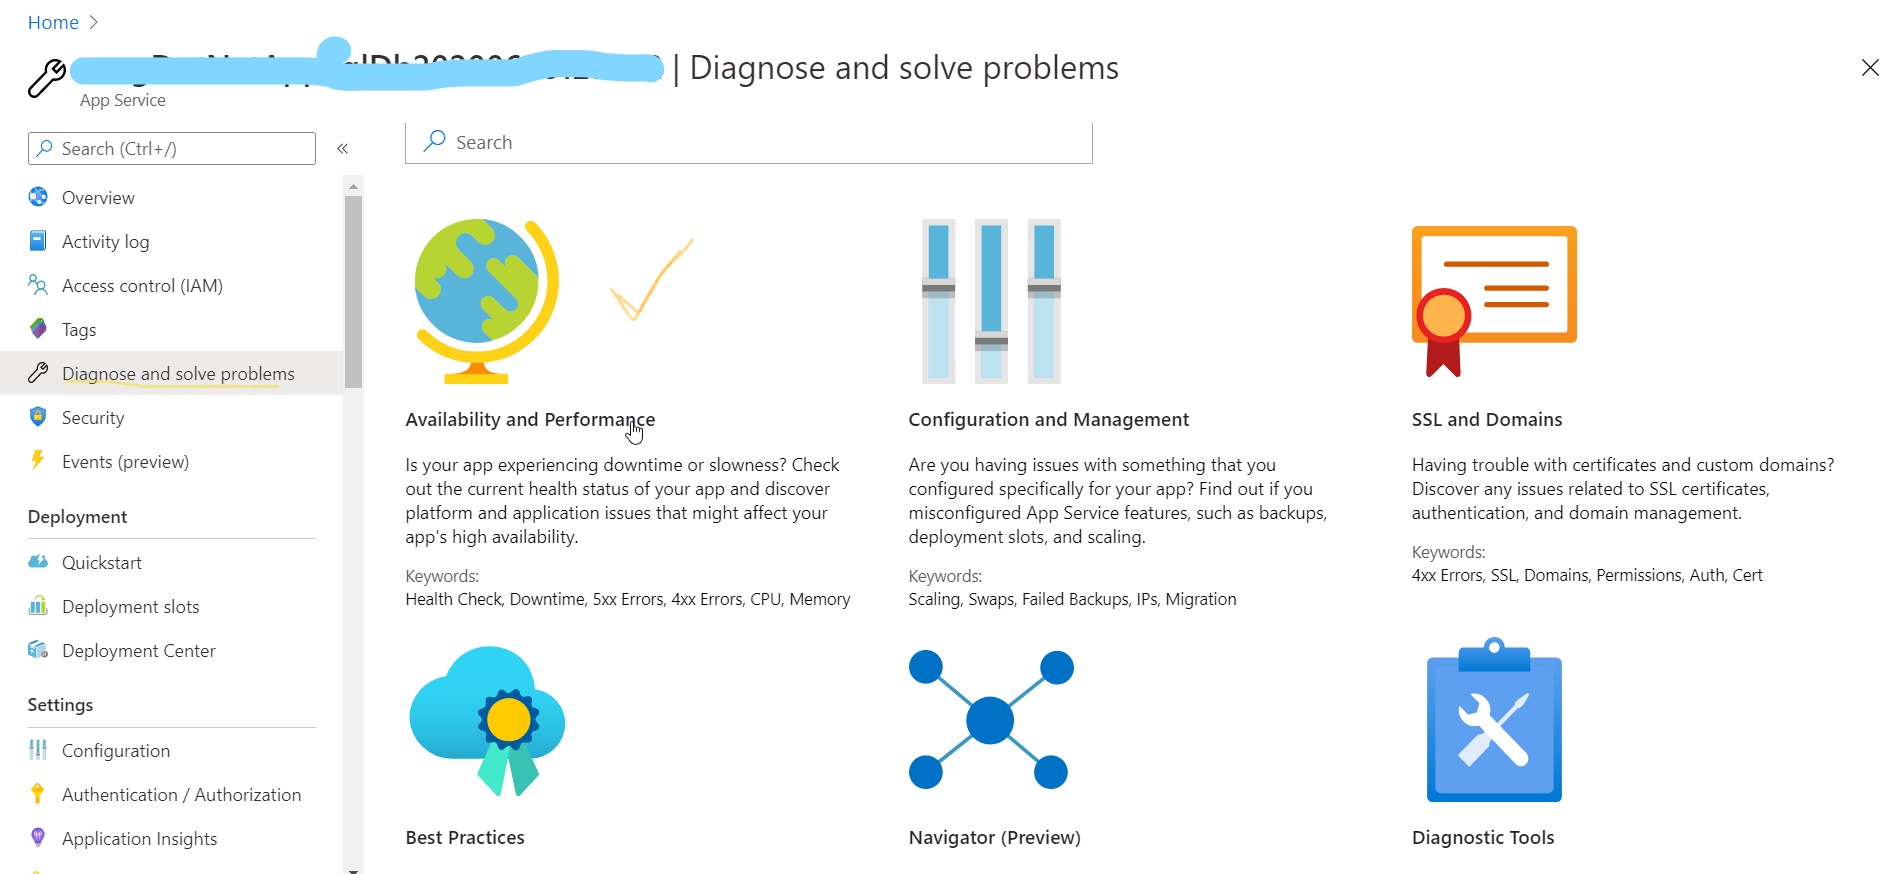
You may access App Service diagnostics, navigate to your App Service web app or App Service Environment in the Azure portal. In the left navigation, click on Diagnose and solve problems.
You may refer to below link for more details on this:
https://azure.github.io/AppService/2020/03/23/A-New-Look-for-App-Service-Diagnostics.html
@SnehaAgrawal-MSFT Hi and thanks for your reply.
I'm running just 1 web app which is the Wordpress website and there aren't active webjobs. The plan used right now is P3V2, the plan active when error was reported was P1V2.
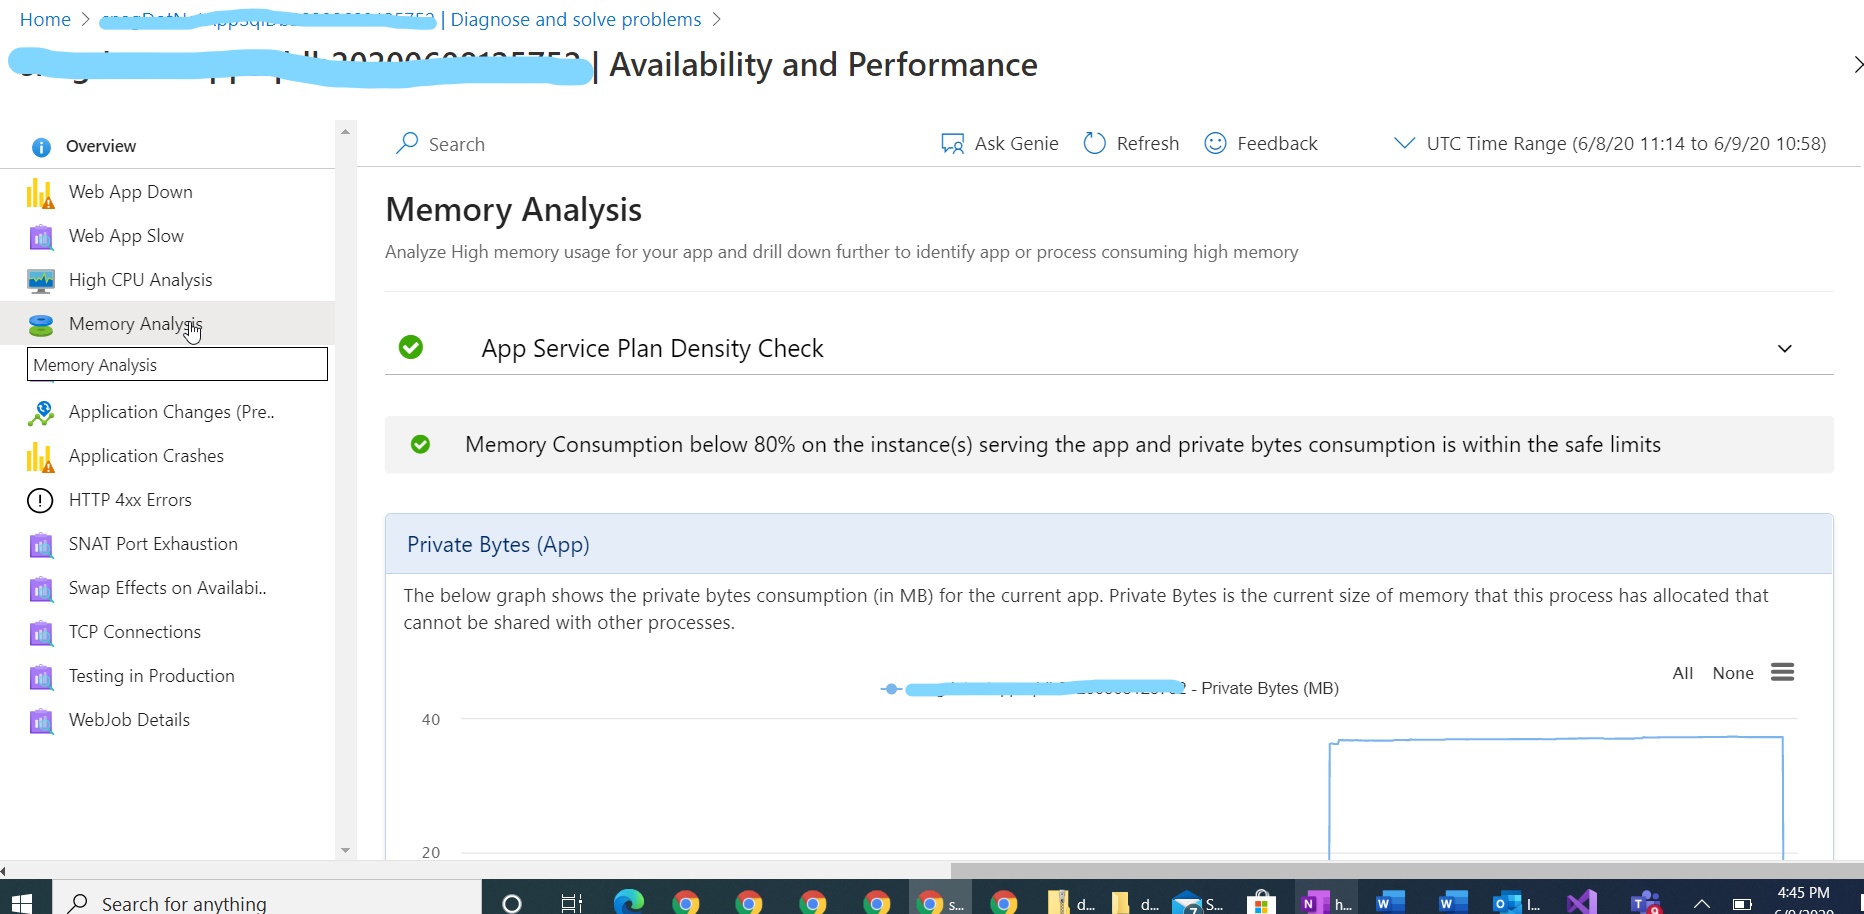
My "Diagnose and solve problems" window is a little bit different but I can check "Memory usage" where I find these values: 
I encountered the problem this morning (check the red rectangle), but if I look at the graph I can see that this morning memory usage was about 25% so it seems far from limit. If I see on metrics I see values that I said before like 3 or more GB of "Average memory working set". In metrics I can see "Requests" value which max value is 550 but it is a value that I reached other times during last days without causing a website downtime.
' cx='32' cy='32' r='32' /%3E%3Ctext x='50%25' y='55%25' dominant-baseline='middle' text-anchor='middle' fill='%23FFF' %3ESK%3C/text%3E%3C/svg%3E)
Hi, The memory get occupied continuously when you have not destroyed(disposed) the object which has larger records/data in it. For example, you are trying to get the active employees from your Org, and list returns you 10 Lac of records and this operation get executed for each request or on particular page. In this case if the users are trying this page, the memory get increased continuously and when the Memory reach 3.5 GB, the app service get restarted and the service will not be available for some time.
Please check such scenario in you application, and also you can find the actual problem as below;
By analyzing the memory dump you will get better idea where the leakage of Memory.
R/Santosh Gada
@SantoshKumarGada-0589 Hello Santosh and thanks for your reply!
I can't find the diagnostic tool you mentioned and this is what "Diagnose and solve problems" windows looks like:
I 
Hi,
Sorry for the delayed answer. Probably you have navigated to the wrong path. Below is the snapshot.
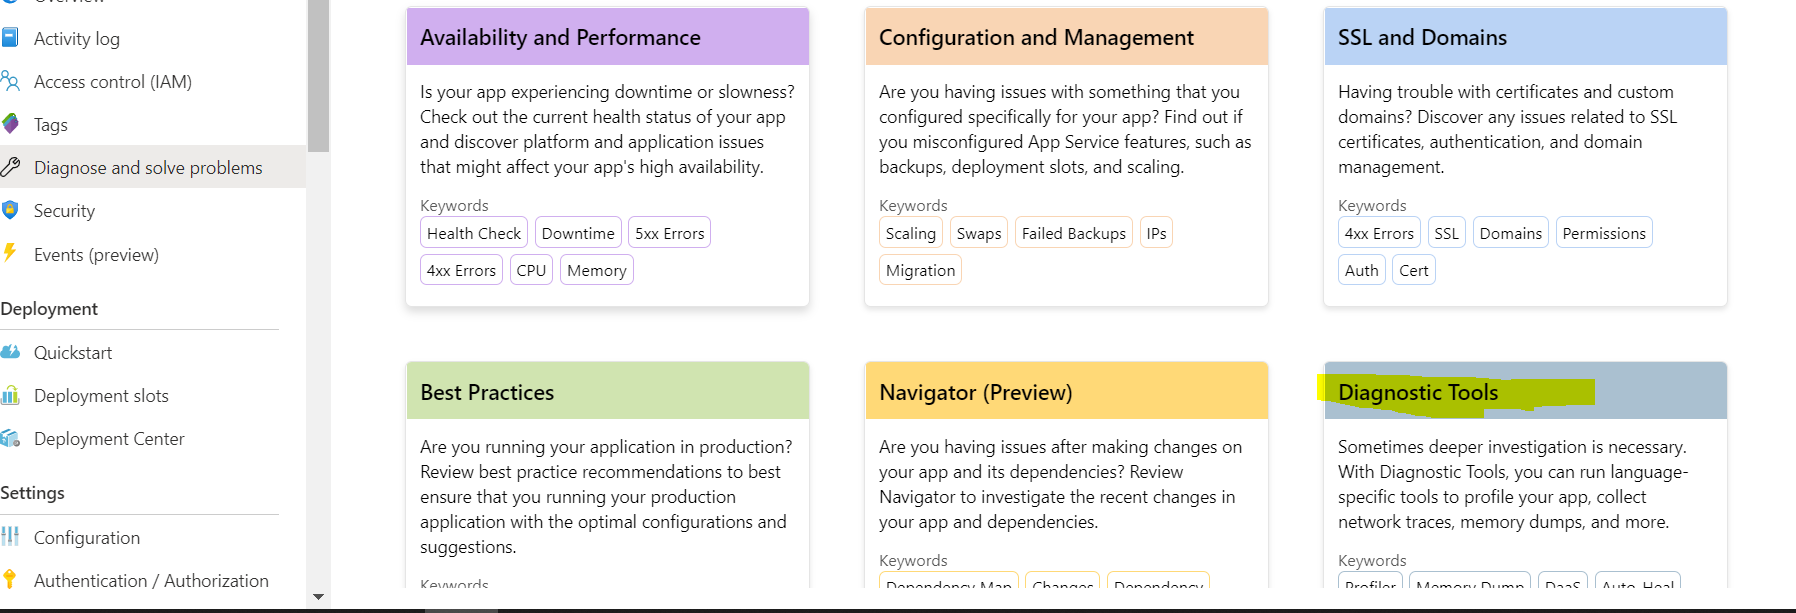
Let me know if you find the one.
R/Santosh Gada