Device usage report
Important
Skype for Business Online operated by 21Vianet in China will be retired on October 1, 2023. If you haven't upgraded your Skype for Business Online users yet, they will be automatically scheduled for an assisted upgrade. If you want to upgrade your organization to Teams yourself, we strongly recommend that you begin planning your upgrade path today. Remember that a successful upgrade aligns technical and user readiness, so be sure to leverage our upgrade guidance as you navigate your journey to Teams.
Skype for Business Online, excluding the service operated by 21Vianet in China, was retired on July 31, 2021.
The Reports dashboard shows you the activity overview across the Microsoft 365 or Office 365 products in your organization. It enables you to drill in to individual product level reports to give you more granular insight about the activities within each product. For example, you can use the Skype for Business device usage report to see the devices including Windows-based operating systems and mobile devices that have the Skype for Business app installed and are using it for IM and meetings.
Check out the Reports overview to learn more.
This report, along with the other Skype for Business reports, gives you details on the types of clients/devices that are used across your organization. These details are helpful when you're investigating, planning, and making other business decisions for your organization.
Note
You can see all of the Skype for Business reports when you log on as an administrator to the Microsoft 365 admin center.
How to get to the Skype for Business device usage report
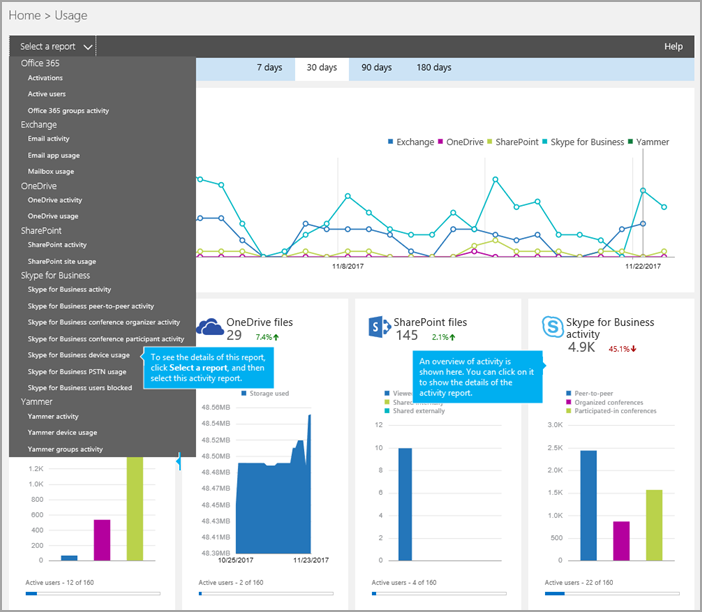
Go to the admin center > Reports > Usage.
On the Usage page, select Skype for Business device usage on the Select a report list on the left. Or, select the Skype for Business activity widget and then select Skype for Business device usage on the Skype for Business activity list.

Depending on the Microsoft 365 or Office 365 subscription you have, you might not see all the products and activity reports shown here.
Interpret the Skype for Business device usage report
You can get a view into the devices that are using the Skype for Business app by looking at the User and Distribution charts.


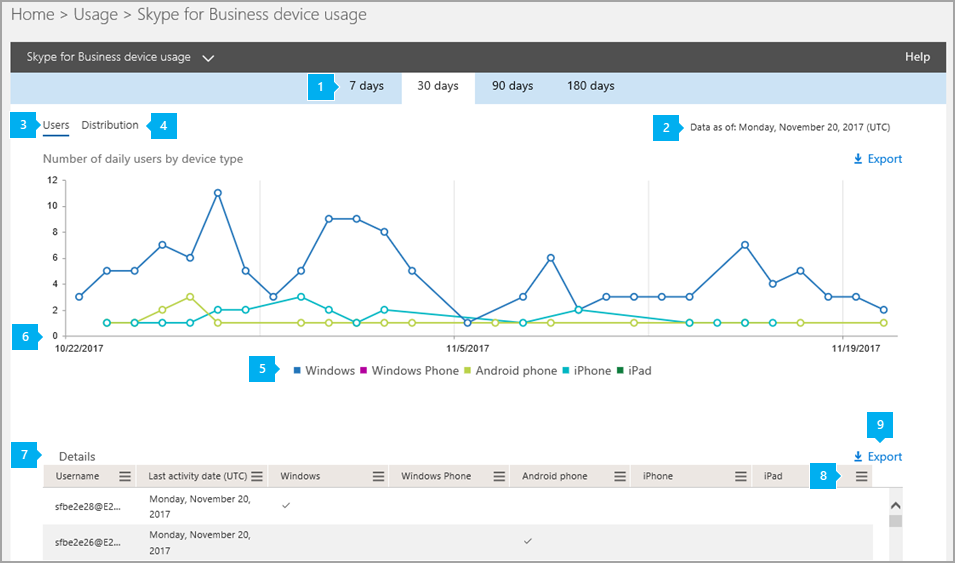
The Skype for Business device usage report can be viewed for trends over the last 7 days, 30 days, 90 days, or 180 days. However, if you select into a particular day in the report, the table (see number 7) will show data for 30 days, up to the date (see number 2) for when the report was generated.
Note
If you click into the details of a specific day, the table will only show data for the 30 days up to the date when the report was generated.

Each report has a date for when this report was generated. The reports usually reflect a 24- to 48-hour latency from time of activity.

Use the interactive chart data on the Users chart to understand usage trends and to see the number of users that are connected using the Skype for Business app that is used in your organization. It will show you the total number of users and types of Windows, Windows Phone, Android phone, iPhone, and iPad devices that have the Skype for Business app installed and are being used across your organization.

Use the interactive chart data on the Distribution bar chart to understand usage to see the number of users using unique devices in your organization. It will show you the total number of Windows, Windows Phone, Android phone, iPhone, and iPad users with a device being used.

You can filter the series you see on the chart by clicking on an item in the legend. For example, on the Users chart, click or tap Windows, Windows Phone, Android phone, iPhone, or iPad to see only the info related to each one. Changing this selection doesn't change the info in the grid table.

Each chart has an 'X' (horizontal) and 'Y' (vertical) axis.
- On the Users chart, the Y axis is the total number of users connected with a device that has the Skype for Business app installed.
- On the Distribution activity chart, the Y axis is the number of users that are connected with a certain type of device with the Skype for Business app installed.
The X axis on both charts is the selected date range for this specific report.

The table shows you a breakdown of the all conferencing activities per user. This shows all users that have Skype for Business assigned to them and their conferencing activities. You can add more columns to the table.
- User name is the name of the user.
- Last activity date (UTC) is the latest time the user engaged in a peer to peer session, or organized a conference or participated in a conference.
- Windows is selected if the user is has the Skype for Business client app installed on a Windows-based operating system and is using it.
- Windows Phone is selected if the user is has the Skype for Business client app installed on a Windows Phone device and is using it.
- Android phone is selected if the user is has the Skype for Business client app installed on an Android phone and is using it.
- iPhone is selected if the user is has the Skype for Business client app installed on an iPhone and is using it.
- iPad is selected if the user is has the Skype for Business client app installed on an iPad and is using it.
If your organization's policies prevent you from viewing reports where user information is identifiable, you can change the privacy setting for all these reports. Check out the How do I hide user level details? section in the Activity Reports in the admin center.

Click or tap the Columns icon in any of the columns to add or remove columns from the report.


You can also export the report data into an Excel .csv file, by clicking or tapping Export.

This exports data of all users and enables you to do simple sorting and filtering for further analysis. If you have less than 2000 users, you can sort and filter within the table in the report itself. If you have more than 2000 users, in order to filter and sort, you'll need to export the data.
Want to see other Skype for Business reports?
Skype for Business activity report You can see how much your users are using peer-to-peer, organized, and participated in conferencing sessions.
Skype for Business conference organizer activity report You can see how much your users are organizing conferences that use IM, audio/video, application sharing, Web, dial-in/out - 3rd party, and dial-in/out - Microsoft.
Skype for Business conference participant activity report You can see how many IM, audio/video, application sharing, Web, and dial-in/out conferencing conferences are being participated in.
Skype for Business peer-to-peer activity report You can see how much your users are using IM, audio/video, application sharing and transferring files.
Skype for Business users blocked report You can see the users in your organization that have been blocked from making PSTN calls.
Skype for Business PSTN usage report You can see the number of minutes spent in inbound/outbound calls and cost for these calls.
Skype for Business PSTN minute pools report you can see the number of minutes consumed during the current month within your organization.
Skype for Business session details report You can see details about individual user's call experiences.