How to Display Time Duration on a Horizontal Bar Graph

Samuel Wolfe 0 Reputation points
2025-03-10T18:18:31.2766667+00:00

Hello, I am a researcher attempting to display surgical times on a horizontal bar graph, with the times labeled on the x-axis in order to compare to eras of time (one from January to June and the other from July to December). I have taken a series of dates and times: each surgery's start time and finish time, calculated surgery time durations, and then converted the times into numbers to graph (1=24 hours). While I am able to generate a graph, I am struggling to make all the times fit on a 24-hour graph. In ways I cannot figure out why, some times are displayed on the graph in a new, 24-hour period instead of in the original period. In other words, all the times are not displayed unless I stretch the x-axis out to more than 48 hours. I cannot figure this out looking at my numbers because no surgery starting time is 1.0 or higher. The other issue is that I want the times that cross 24 hours, or start before midnight and end after, to be displayed back on the left side of the graph again instead of just running off the right edge of the graph. Graph is attached with some numbers for example:

I have already tried:

manually subtracting the number "1" from times that go over 24 hours and then adding those as new data points

making sure the x-axis only displays 24 hours in total

Another detail for the graph: 12 PM noon should be the midline of the x-axis. Using 24 hour time.

See the following images for better context that will hopefully explain:

Screenshot 2025-03-09 153311

Screenshot 2025-03-09 1532481) why can't I get the times once they reach 12 AM to come back to the left side?

  1. If I extend this graph to another 24 hours (48 total), you get more times beginning, at say, 5 AM the next day. Why can't that be displayed in the first 24 hour period?

Note the formula used below to convert times to numbers for display:

Screenshot 2025-03-09 153343

Excel Management
Excel Management
Excel: A family of Microsoft spreadsheet software with tools for analyzing, charting, and communicating data.Management: The act or process of organizing, handling, directing or controlling something.
1,798 questions
0 comments No comments
{count} votes

2 answers

Sort by: Most helpful
  1. riny 430 Reputation points
    2025-03-11T09:22:00.02+00:00

    Similar to Jiajing though less complicated.

    User's image

    In G, just enter 0 for all time sequences.

    In H3 (and copied down): =IF(D3<C3, D3,0)

    In I3 (and copied down): =C3-H3

    In J3 (and copied down): =IF(H3,1-H3-I3, D3-I3)

    The stacked bar chart will create three bars, one of which represents 'the gap' from midnight until the start time of a time sequence that starts and finishes the same day. Or 'the gap' between the end time and the start time when the time sequence passed midnight. Set that gap to 'no fill' and you are left with one or two visible bars. Set the same color for to get the chart as shown above.

    Finally, the x-axis was set with boundaries from 0 to 1 and a major unit to 0.08333333 to get the hourly intervals,

    1 person found this answer helpful.

  2. Jiajing Hua-MFST 15,865 Reputation points Microsoft External Staff
    2025-03-11T08:22:41.29+00:00

    Hi,

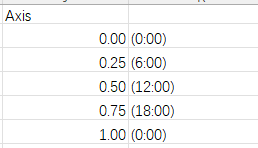
    Because Excel does not have "24:00", it is recommended to change the calculation unit from 24 hours to 1 day and set the interval of the X axis to 0-1.

    User's image

    For surgeries that end at midnight (24:00), split them into two time periods: before midnight and after midnight.

    User's image

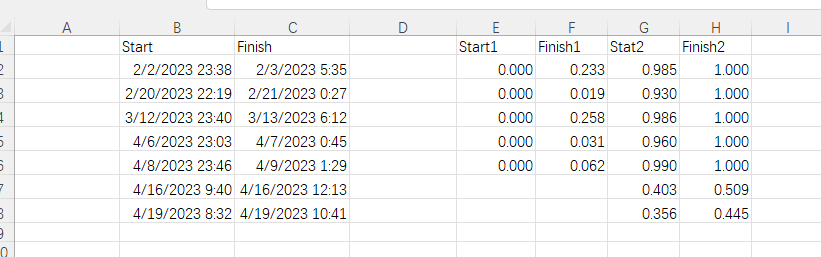
    Start1: =IF(DATEDIF(B2,C2,"D")>0,0,"")

    Finish1: =IF(DATEDIF(B2,C2,"D")>0,(HOUR(C2)+MINUTE(C2)/60)/24,"")

    Start2: =(HOUR(B2)+MINUTE(B2)/60)/24

    Finish2: =IF(DATEDIF(B2,C2,"D")>0,1,(HOUR(C2)+MINUTE(C2)/60)/24)

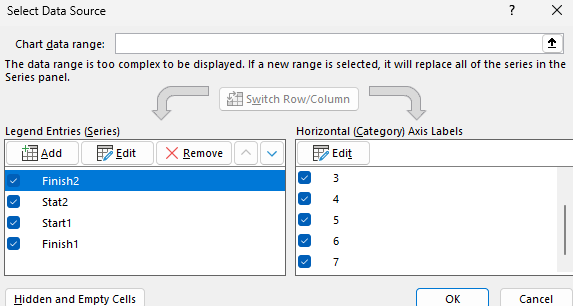
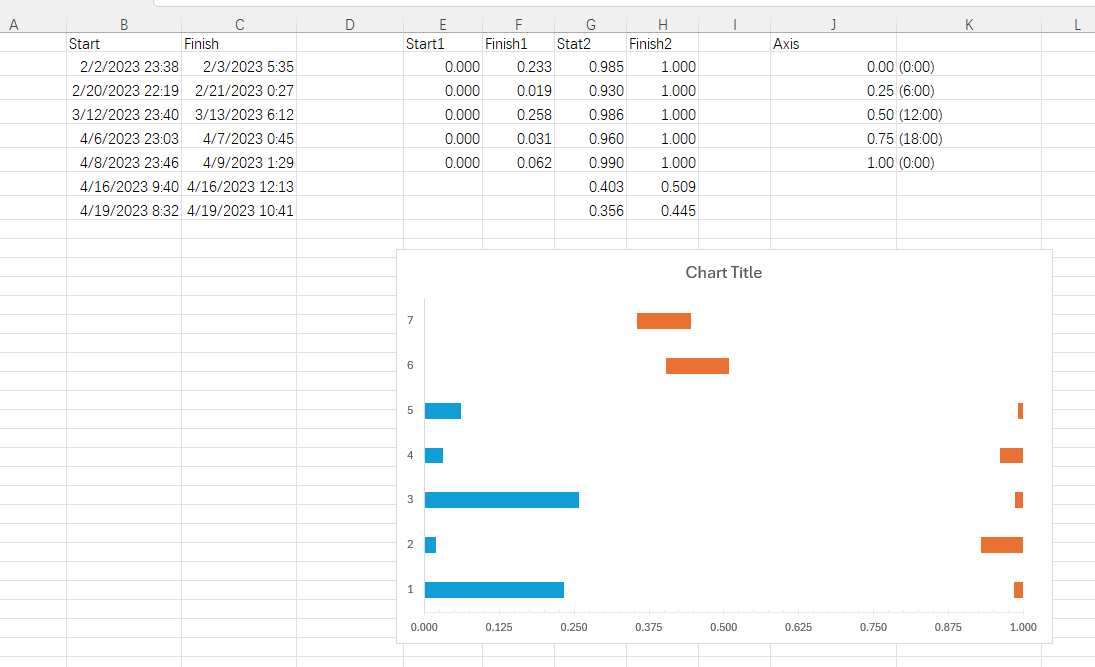
    Then please add 4 series in your chart.

    User's image

    User's image


    If the answer is helpful, please click "Accept Answer" and kindly upvote it. If you have extra questions about this answer, please click "Comment".

    Note: Please follow the steps in our documentation to enable e-mail notifications if you want to receive the related email notification for this thread.


    0 comments No comments

Your answer

Answers can be marked as Accepted Answers by the question author, which helps users to know the answer solved the author's problem.