Tutorial: Create a query with the visual query builder in a Warehouse
Applies to: ✅ SQL analytics endpoint and Warehouse in Microsoft Fabric
In this tutorial, learn how to create a query with the visual query builder.
Note
This tutorial forms part of an end-to-end scenario. In order to complete this tutorial, you must first complete these tutorials:
Use the visual query builder
In this task, learn how to create a query with the visual query builder.
Ensure that the workspace you created in the first tutorial is open.
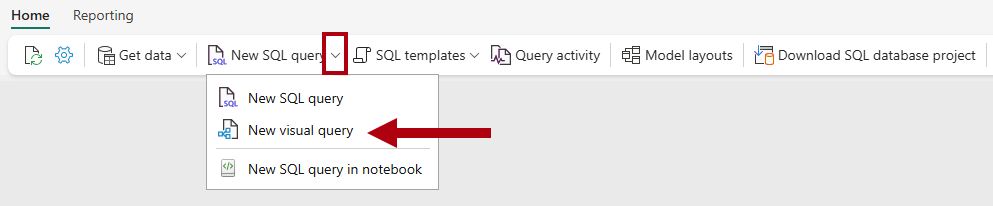
On the Home ribbon, open the New SQL query dropdown, and then select New visual query.
From the Explorer pane, from the
dboschema Tables folder, drag thefact_saletable to the visual query canvas.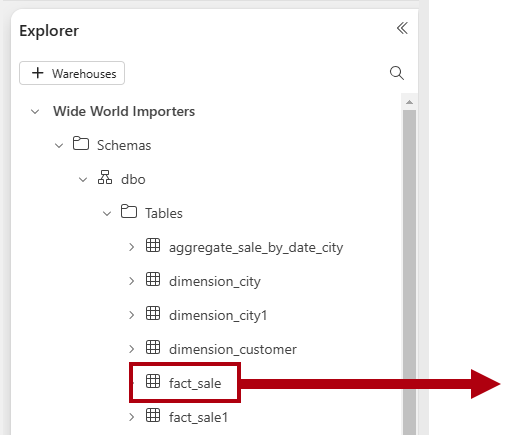
To limit the dataset size, on the query designer ribbon, select Reduce rows > Keep top rows.
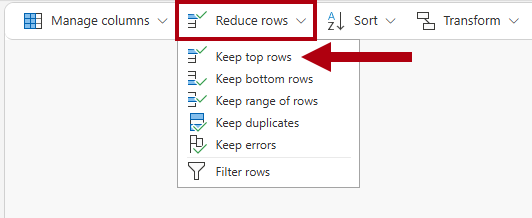
In the Keep top rows window, enter
10000, and then select OK.From the Explorer pane, from the
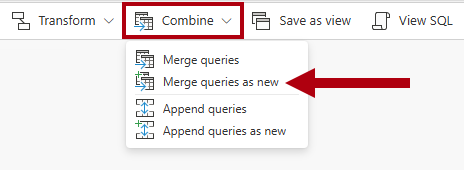
dboschema Tables folder, drag thedimension_citytable to the visual query canvas.To join the tables, on the query designer ribbon, select Combine > Merge queries as new.
In the Merge dialog, complete the following settings:
In the Left table for merge dropdown, select
dimension_city.In the following grid, select the
CityKeycolumn.In the Right table for merge dropdown, select
fact_sale.In the following grid, select the
CityKeycolumn.In the Join kind section, select Inner.
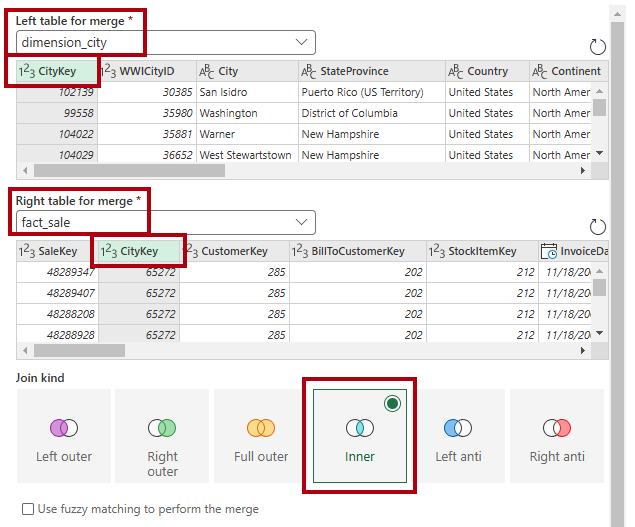
Select OK.
In the data preview pane, locate the
fact_salecolumn (the last column).
In the
fact_salecolumn header, select the Expand button.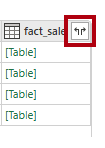
In the column selector dialog, select only these three columns:
TaxAmount,Profit, andTotalIncludingTax.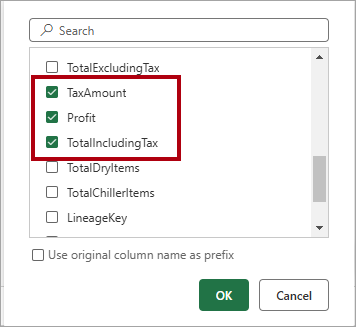
Select OK.
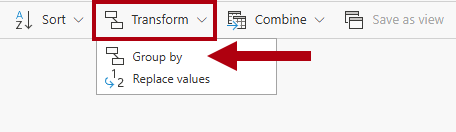
To aggregate the dataset, on the ribbon, select Transform > Group by.
In the Group by dialog, complete the following settings:
In the three Group by dropdowns, set the following options:
CountryStateProvinceCity
In the New column name box, enter the name
SumOfTaxAmount.- In the Operation dropdown, select Sum.
- In the Column dropdown, select
TaxAmount.
Select Add aggregation.
Set the aggregation as follows:
- New column name:
SumOfProfit - Operation: Sum
- Column:
Profit
- New column name:
Add another aggregation, and set the aggregation as follows:
- New column name:
SumOfTotalIncludingTax - Operation: Sum
- Column:
TotalIncludingTax
- New column name:
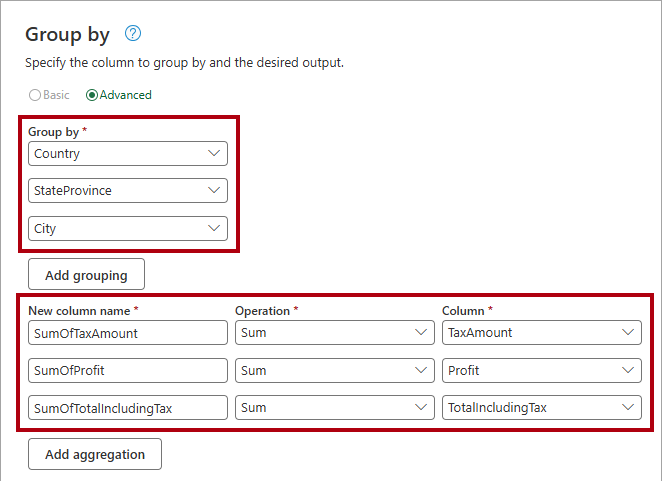
Select OK.
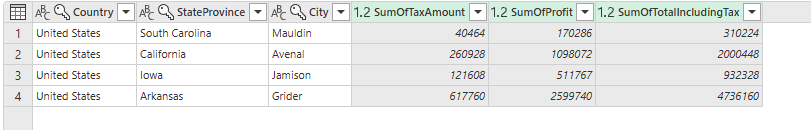
Review the query result in the data preview pane.
Rename the query, right-click on the query tab, and then select Rename.
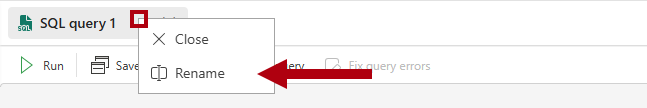
In the Rename window, replace the name with
Sales Summary, and then select Rename.