Use extended Apache Spark history server to debug and diagnose Apache Spark applications
This article provides guidance on how to use the extended Apache Spark history server to debug and diagnose completed and running Apache Spark applications.
Access the Apache Spark history server
The Apache Spark history server is the web user interface for completed and running Spark applications. You can open the Apache Spark web user interface (UI) from the progress indicator notebook or the Apache Spark application detail page.
Open the Spark web UI from progress indicator notebook
When an Apache Spark job is triggered, the button to open Spark web UI is inside the More action option in the progress indicator. Select Spark web UI and wait for a few seconds, then the Spark UI page appears.
Open the Spark web UI from Apache Spark application detail page
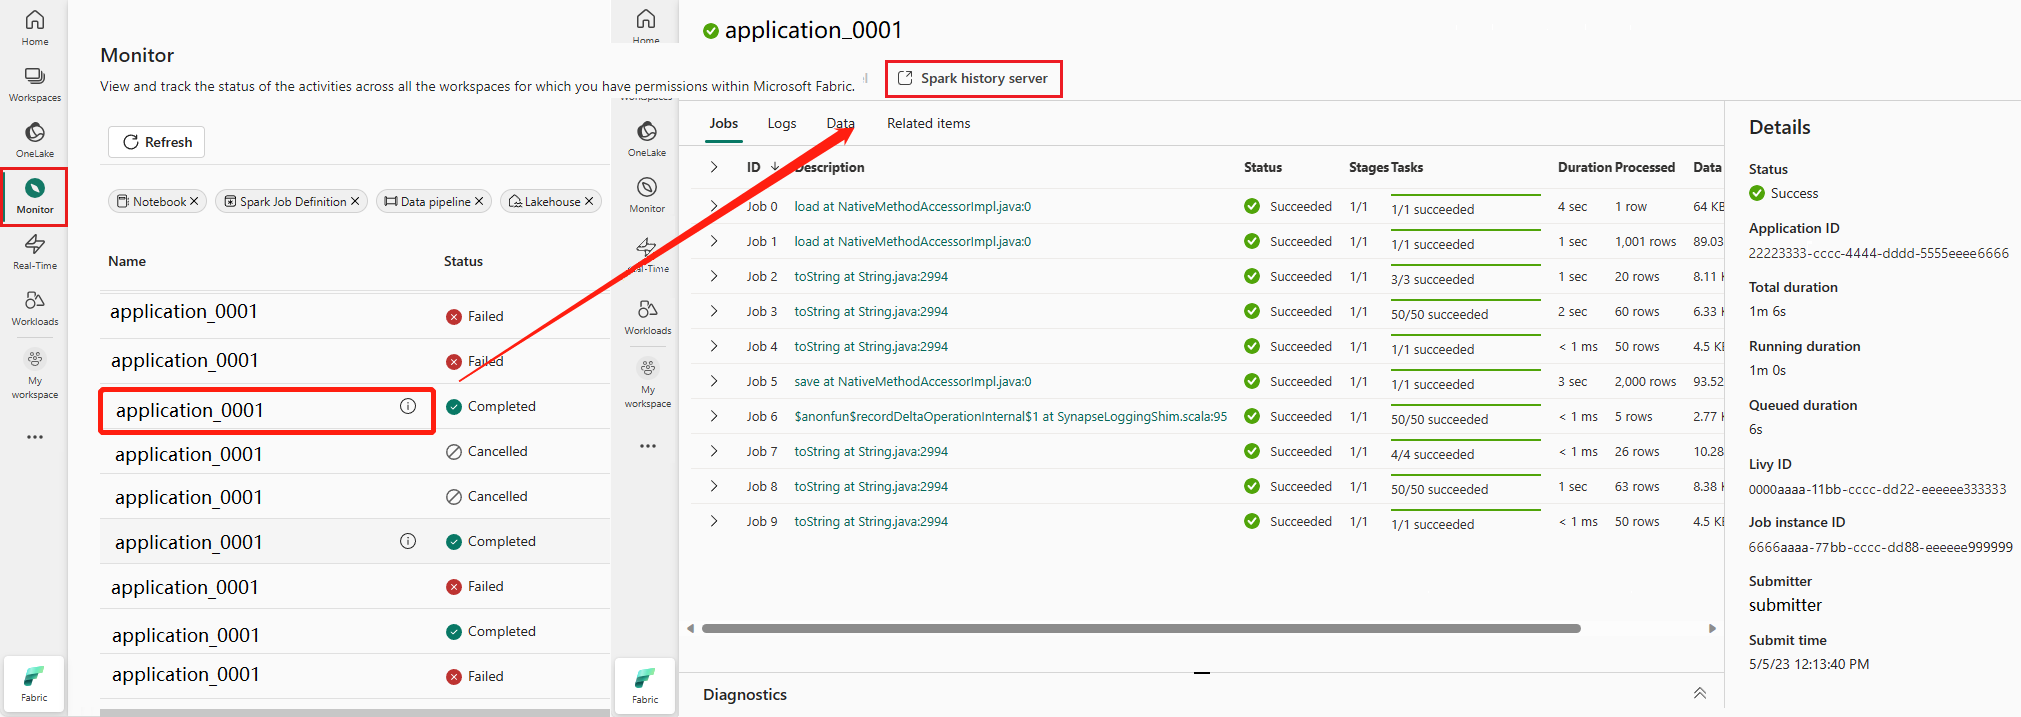
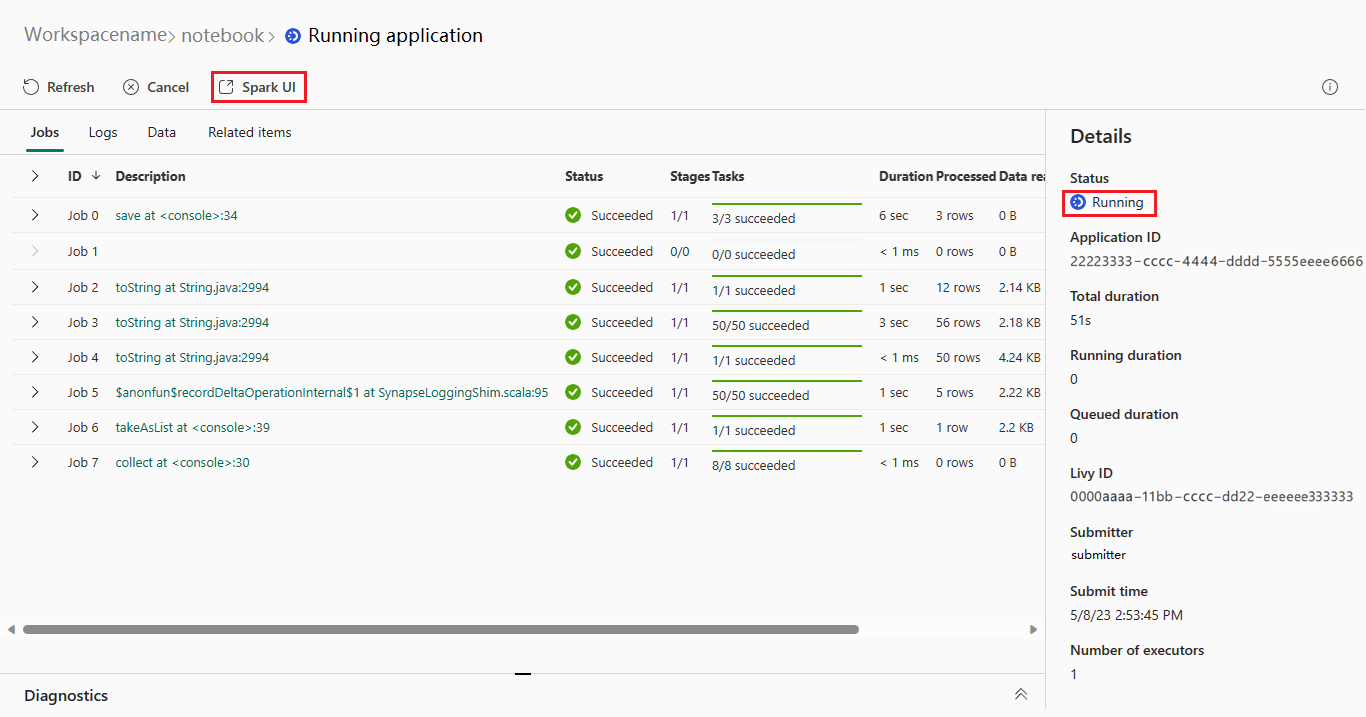
The Spark web UI can also be opened through the Apache Spark application detail page. Select Monitor on the left side of the page, and then select an Apache Spark application. The detail page of the application appears.
For an Apache Spark application whose status is running, the button shows Spark UI. Select Spark UI and the Spark UI page appears.
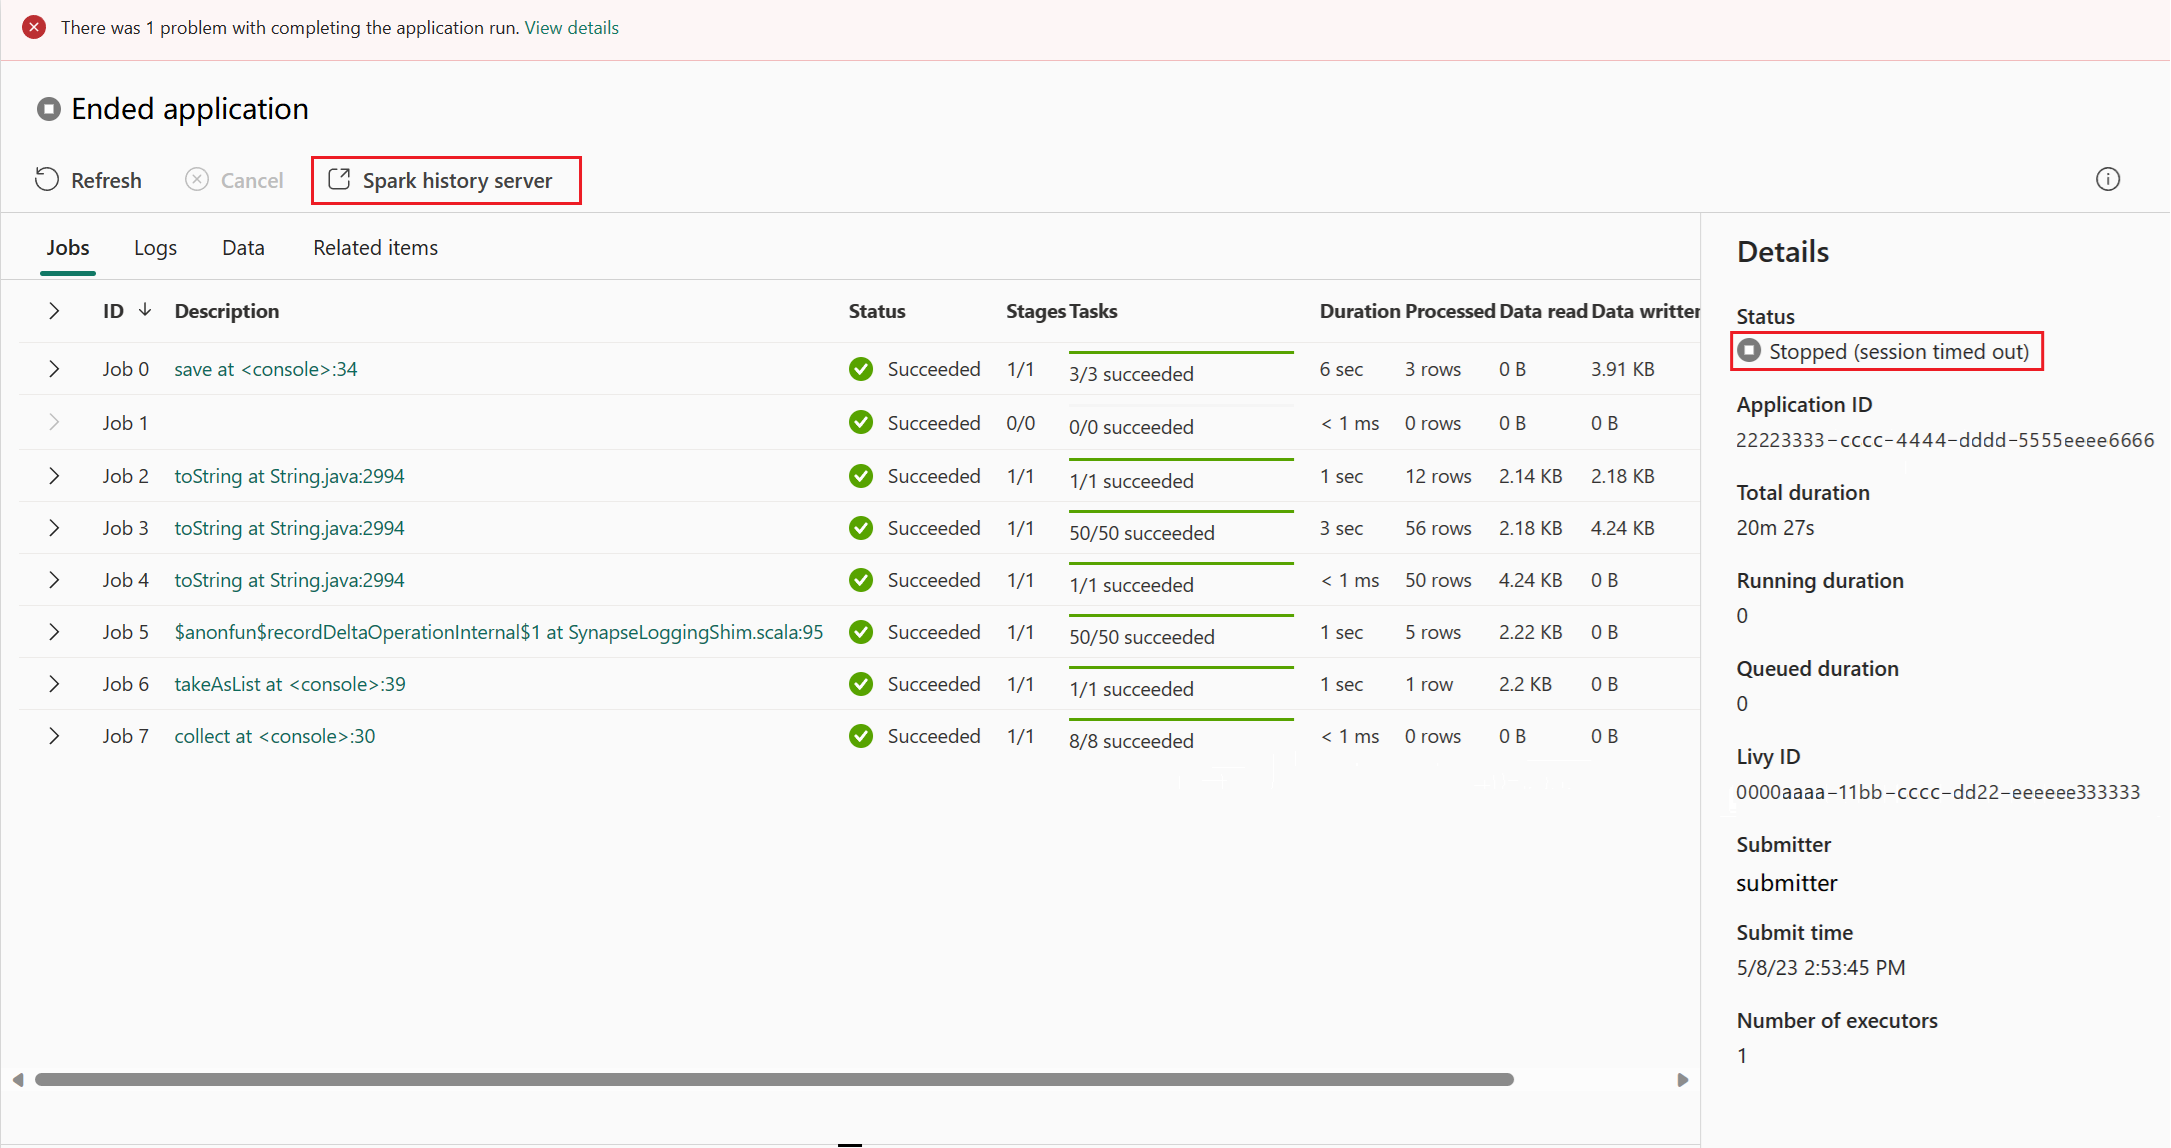
For an Apache Spark application whose status is ended, the ended status can be Stopped, Failed, Canceled, or Completed. The button shows Spark history server. Select Spark history server and the Spark UI page appears.
Graph tab in Apache Spark history server
Select the Job ID for the job you want to view. Then, select Graph on the tool menu to get the job graph view.
Overview
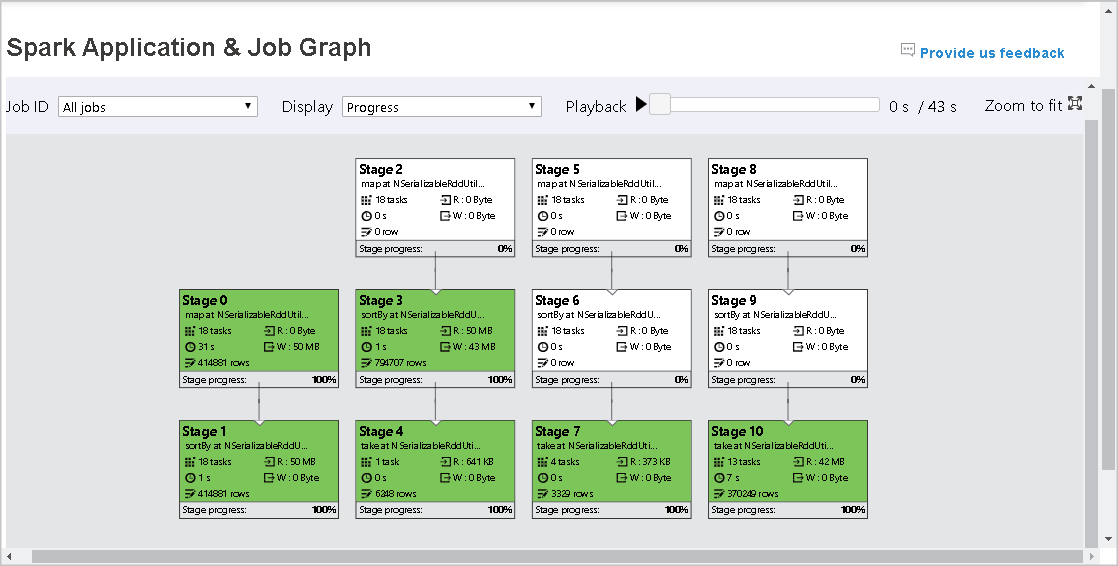
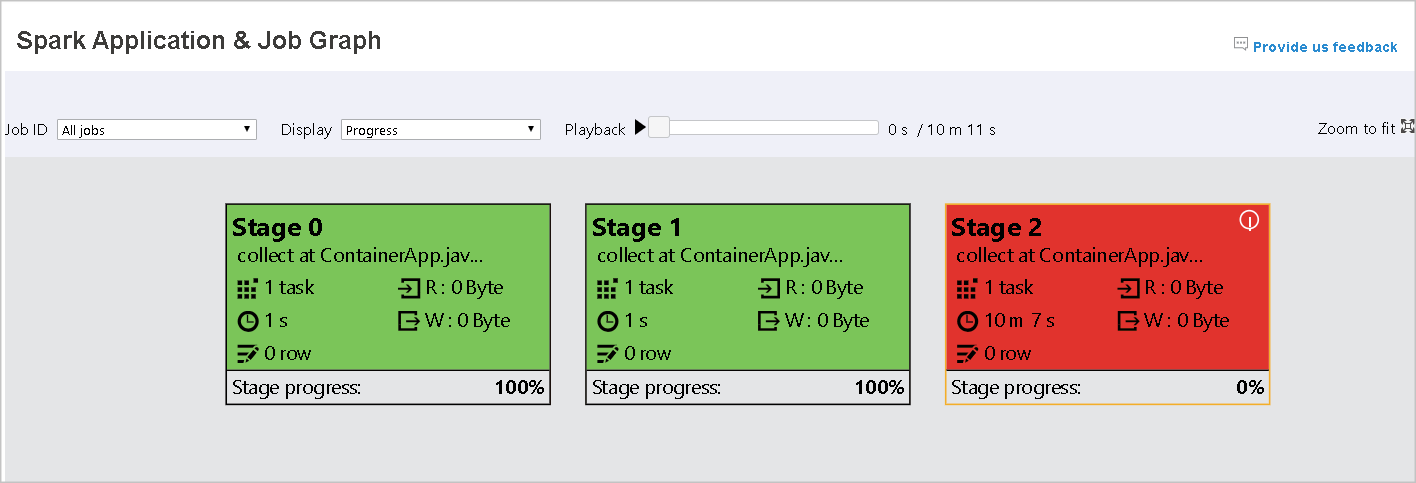
You can see an overview of your job in the generated job graph. By default, the graph shows all jobs. You can filter this view by Job ID.
Display
By default, the Progress display is selected. You can check the data flow by selecting Read or Written in the Display dropdown list.
The graph node displays the colors shown in the heatmap legend.
Playback
To play back the job, select Playback. You can select Stop at any time to stop. The task colors show different statuses when playing back:
| Color | Meaning |
|---|---|
| Green | Succeeded: The job has completed successfully. |
| Orange | Retried: Instances of tasks that failed but don't affect the final result of the job. These tasks had duplicate or retry instances that may succeed later. |
| Blue | Running: The task is running. |
| White | Waiting or skipped: The task is waiting to run, or the stage has skipped. |
| Red | Failed: The task has failed. |
The following image shows green, orange, and blue status colors.
The following image shows green and white status colors.
The following image shows red and green status colors.
Note
The Apache Spark history server allows playback for each completed job (but does not allow playback for incomplete jobs).
Zoom
Use your mouse scroll to zoom in and out on the job graph, or select Zoom to fit to make it fit to screen.
Tooltips
Hover on graph node to see the tooltip when there are failed tasks, and select a stage to open its stage page.
On the job graph tab, stages have a tooltip and a small icon displayed if they have tasks that meet the following conditions:
| Condition | Description |
|---|---|
| Data skew | Data read size > average data read size of all tasks inside this stage * 2 and data read size > 10 MB. |
| Time skew | Execution time > average execution time of all tasks inside this stage * 2 and execution time > 2 minutes. |
Graph node description
The job graph node displays the following information of each stage:
- ID
- Name or description
- Total task number
- Data read: the sum of input size and shuffle read size
- Data write: the sum of output size and shuffle writes size
- Execution time: the time between start time of the first attempt and completion time of the last attempt
- Row count: the sum of input records, output records, shuffle read records and shuffle write records
- Progress
Note
By default, the job graph node displays information from the last attempt of each stage (except for stage execution time). However, during playback, the graph node shows information of each attempt.
The data size of read and write is 1MB = 1000 KB = 1000 * 1000 bytes.
Provide feedback
Send feedback with issues by selecting Provide us feedback.
Stage number limit
For performance consideration, by default the graph is only available when the Spark application has less than 500 stages. If there are too many stages, it will fail with an error like this:
The number of stages in this application exceeds limit (500), graph page is disabled in this case.
As a workaround, before starting a Spark application, please apply this Spark configuration to increase the limit:
spark.ui.enhancement.maxGraphStages 1000
But please notice that this may cause bad performance of the page and the API, because the content can be too large for browser to fetch and render.
Explore the Diagnosis tab in Apache Spark history server
To access the Diagnosis tab, select a job ID. Then select Diagnosis on the tool menu to get the job Diagnosis view. The diagnosis tab includes Data Skew, Time Skew, and Executor Usage Analysis.
Check the Data Skew, Time Skew, and Executor Usage Analysis by selecting the tabs respectively.
Data Skew
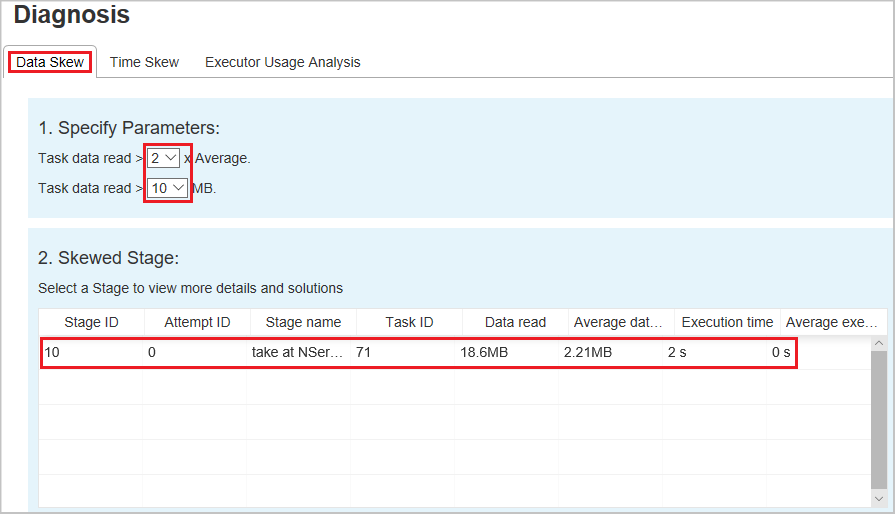
When you select the Data Skew tab, the corresponding skewed tasks are displayed based on the specified parameters.
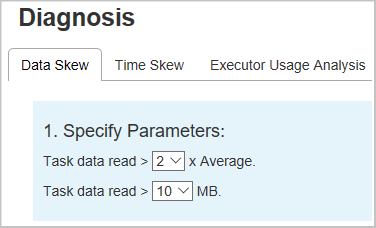
Specify Parameters - The first section displays the parameters, which are used to detect Data Skew. The default rule is: task data read is greater than three times of the average task data read, and the task data read is more than 10 MB. If you want to define your own rule for skewed tasks, you can choose your parameters. The Skewed Stage and Skew Char sections are refreshed accordingly.
Skewed Stage - The second section displays stages, which have skewed tasks meeting the criteria previously specified. If there's more than one skewed task in a stage, the skewed stage table only displays the most skewed task (for example, the largest data for data skew).
Skew Chart - When a row in the skew stage table is selected, the skew chart displays more task distribution details based on data read and execution time. The skewed tasks are marked in red and the normal tasks are marked in blue. The chart displays up to 100 sample tasks, and the task details are displayed in right bottom panel.
Time Skew
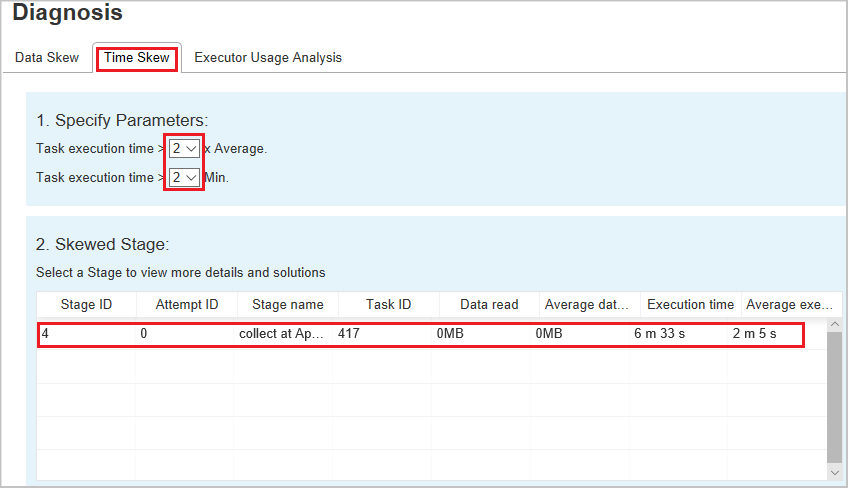
The Time Skew tab displays skewed tasks based on task execution time.
Specify Parameters - The first section displays the parameters, which are used to detect time skew. The default criteria to detect time skew is: task execution time is greater than three times of average execution time and task execution time is greater than 30 seconds. You can change the parameters based on your needs. The Skewed Stage and Skew Chart display the corresponding stages and tasks information just like the Data Skew tab described previously.
Select Time Skew, then filtered result is displayed in Skewed Stage section according to the parameters set in section Specify Parameters. Select one item in Skewed Stage section, then the corresponding chart is drafted in section 3, and the task details are displayed in right bottom panel.
Executor Usage Analysis
This feature has been deprecated in Fabric now. If you still want to use this as a workaround, please access the page by explicitly adding "/executorusage" behind path "/diagnostic" in the URL, like this:

