Networking metrics in .NET
Metrics are numerical measurements reported over time. They're typically used to monitor the health of an app and generate alerts.
Starting with .NET 8, the System.Net.Http and the System.Net.NameResolution components are instrumented to publish metrics using .NET's new System.Diagnostics.Metrics API.
These metrics were designed in cooperation with OpenTelemetry to make sure they're consistent with the standard and work well with popular tools like Prometheus and Grafana.
They're also multi-dimensional, meaning that measurements are associated with key-value pairs called tags (also known as attributes or labels). Tags enable the categorization of the measurement to help analysis.
Tip
For a comprehensive list of all built-in instruments together with their attributes, see System.Net metrics.
Collect System.Net metrics
To take advantage of the built-in metrics instrumentation, a .NET app needs to be configured to collect these metrics. This typically means transforming them for external storage and analysis, for example, to monitoring systems.
There are several ways to collect networking metrics in .NET.
- For a quick overview using a simple, self-contained example, see Collect metrics with dotnet-counters.
- For production-time metrics collection and monitoring, you can use Grafana with OpenTelemetry and Prometheus or Azure Monitor Application Insights. However, these tools might be inconvenient to use at development time because of their complexity.
- For development-time metrics collection and troubleshooting, we recommend using .NET Aspire, which provides a simple but extensible way to kickstart metrics and distributed tracing in your application and to diagnose issues locally.
- It's also possible to reuse the Aspire Service Defaults project without the Aspire orchestration, which is a handy way to introduce the OpenTelemetry tracing and metrics configuration APIs into your ASP.NET project.
Collect metrics with dotnet-counters
dotnet-counters is a cross-platform command line tool for ad-hoc examination of .NET metrics and first-level performance investigation.
For the sake of this tutorial, create an app that sends HTTP requests to various endpoints in parallel.
dotnet new console -o HelloBuiltinMetrics
cd ..\HelloBuiltinMetrics
Replace the contents of Program.cs with the following sample code:
using System.Net;

string[] uris = ["http://example.com", "http://httpbin.org/get", "https://example.com", "https://httpbin.org/get"];
using HttpClient client = new()
{
    DefaultRequestVersion = HttpVersion.Version20
};

Console.WriteLine("Press any key to start.");
Console.ReadKey();

while (!Console.KeyAvailable)
{
    await Parallel.ForAsync(0, Random.Shared.Next(20), async (_, ct) =>
    {
        string uri = uris[Random.Shared.Next(uris.Length)];
        try
        {
            byte[] bytes = await client.GetByteArrayAsync(uri, ct);
            await Console.Out.WriteLineAsync($"{uri} - received {bytes.Length} bytes.");
        }
        catch { await Console.Out.WriteLineAsync($"{uri} - failed."); }
    });
}
Make sure dotnet-counters is installed:
dotnet tool install --global dotnet-counters
Start the HelloBuiltinMetrics app.
dotnet run -c Release
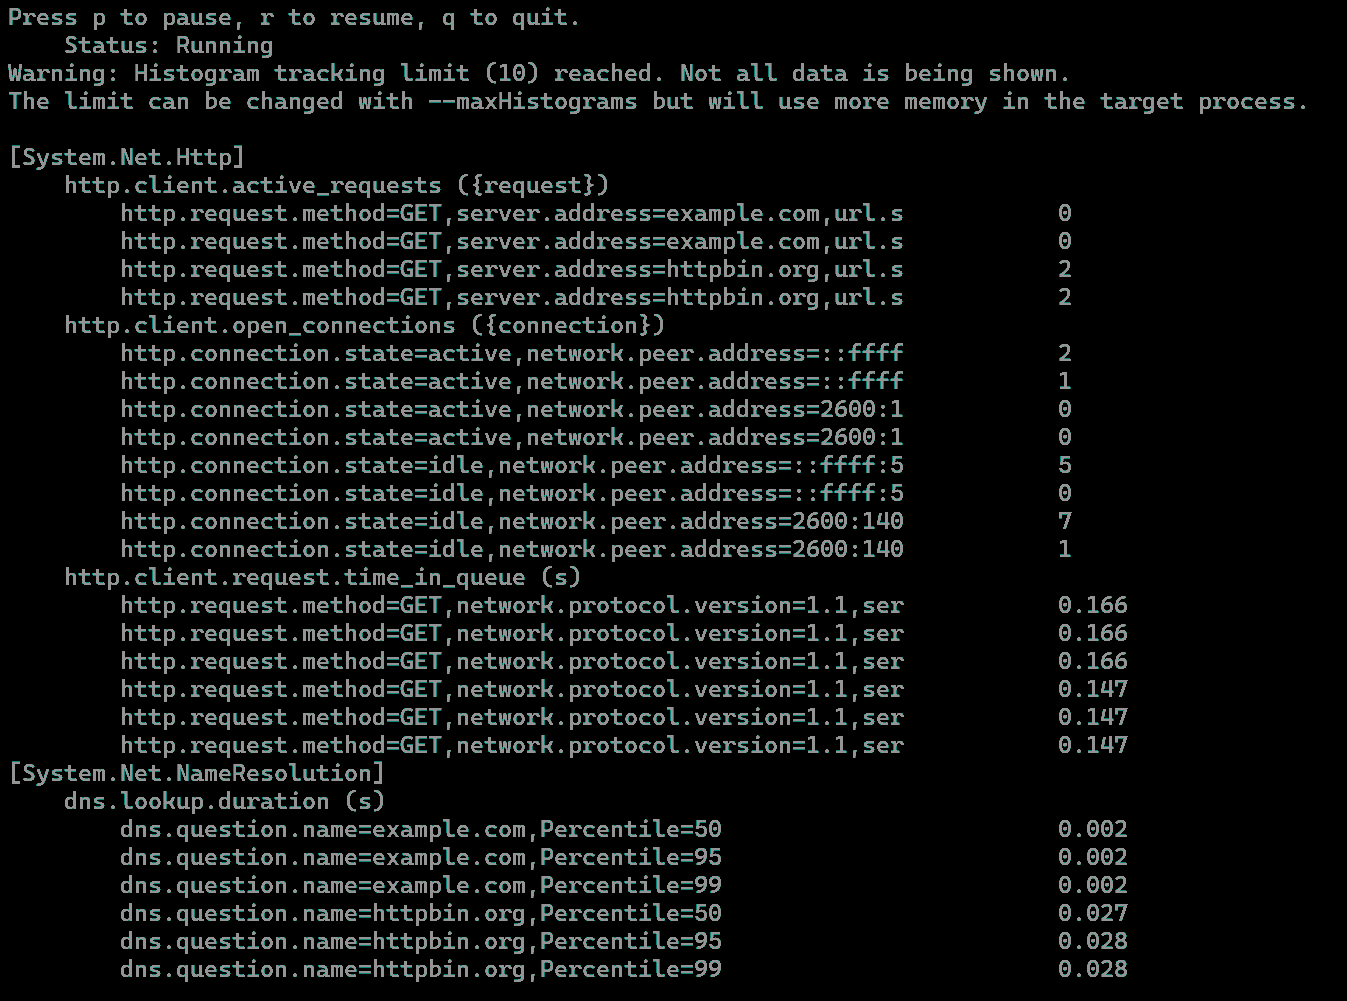
Start dotnet-counters in a separate CLI window and specify the process name and the meters to watch, then press a key in the HelloBuiltinMetrics app so it starts sending requests. As soon as measurements start landing, dotnet-counters continuously refreshes the console with the latest numbers:
dotnet-counters monitor --counters System.Net.Http,System.Net.NameResolution -n HelloBuiltinMetrics
Collect metrics with .NET Aspire
A simple way to collect traces and metrics in ASP.NET applications is to use .NET Aspire. .NET Aspire is a set of extensions to .NET to make it easy to create and work with distributed applications. One of the benefits of using .NET Aspire is that telemetry is built in, using the OpenTelemetry libraries for .NET.
The default project templates for .NET Aspire contain a ServiceDefaults project. Each service in the .NET Aspire solution has a reference to the Service Defaults project. The services use it to set up and configure OTel.
The Service Defaults project template includes the OTel SDK, ASP.NET, HttpClient, and Runtime Instrumentation packages. These instrumentation components are configured in the Extensions.cs file. To support telemetry visualization in Aspire Dashboard, the Service Defaults project also includes the OTLP exporter by default.
Aspire Dashboard is designed to bring telemetry observation to the local debug cycle, which enables developers to ensure that the applications are producing telemetry. The telemetry visualization also helps to diagnose those applications locally. Being able to observe the calls between services is as useful at debug time as in production. The .NET Aspire dashboard is launched automatically when you F5 the AppHost Project from Visual Studio or dotnet run the AppHost project from command line.
Quick walkthrough
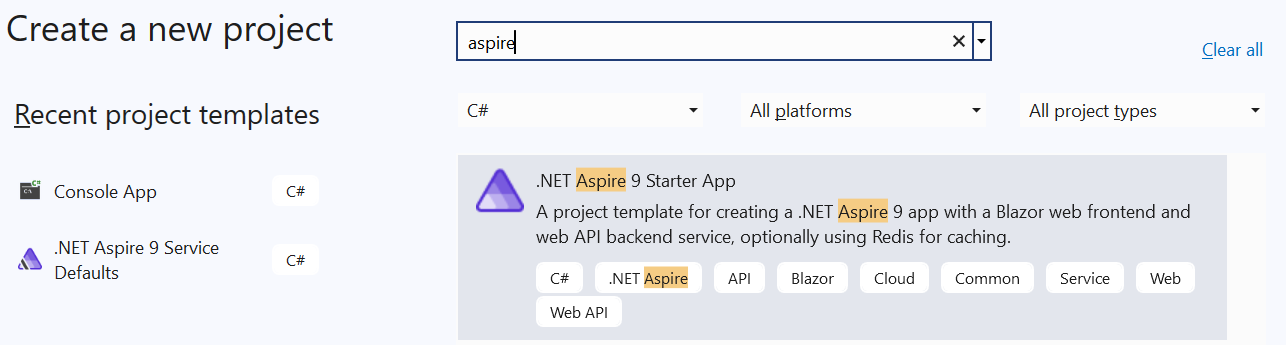
Create a .NET Aspire 9 Starter App by using
dotnet new:dotnet new aspire-starter-9 --output AspireDemoOr in Visual Studio, create a new project and select the .NET Aspire 9 Starter App template:
Open
Extensions.csin theServiceDefaultsproject, and scroll to theConfigureOpenTelemetrymethod. Notice theAddHttpClientInstrumentation()call subscribing to the networking meters..WithMetrics(metrics => { metrics.AddAspNetCoreInstrumentation() .AddHttpClientInstrumentation() .AddRuntimeInstrumentation(); })Note that on .NET 8+,
AddHttpClientInstrumentation()can be replaced by manual meter subscriptions:.WithMetrics(metrics => { metrics.AddAspNetCoreInstrumentation() .AddMeter("System.Net.Http") .AddMeter("System.Net.NameResolution") .AddRuntimeInstrumentation(); })Run the
AppHostproject. This should launch the Aspire Dashboard.Navigate to the Weather page of the
webfrontendapp to generate anHttpClientrequest towardsapiservice. Refresh the page several times to send multiple requests.Return to the Dashboard, navigate to the Metrics page, and select the
webfrontendresource. Scrolling down, you should be able to browse the built-inSystem.Netmetrics.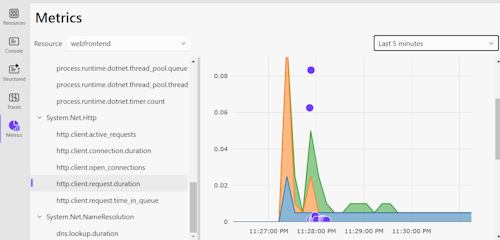

For more information on .NET Aspire, see:
Reuse Service Defaults project without .NET Aspire orchestration
The Aspire Service Defaults project provides an easy way to configure OTel for ASP.NET projects, even if not using the rest of .NET Aspire such as the AppHost for orchestration. The Service Defaults project is available as a project template via Visual Studio or dotnet new. It configures OTel and sets up the OTLP exporter. You can then use the OTel environment variables to configure the OTLP endpoint to send telemetry to, and provide the resource properties for the application.
The steps to use ServiceDefaults outside .NET Aspire are:
Add the ServiceDefaults project to the solution using Add New Project in Visual Studio, or use
dotnet new:dotnet new aspire-servicedefaults --output ServiceDefaultsReference the ServiceDefaults project from your ASP.NET application. In Visual Studio, select Add > Project Reference and select the ServiceDefaults project"
Call the OpenTelemetry setup function
ConfigureOpenTelemetry()as part of your application builder initialization.var builder = WebApplication.CreateBuilder(args) builder.ConfigureOpenTelemetry(); // Extension method from ServiceDefaults. var app = builder.Build(); app.MapGet("/", () => "Hello World!"); app.Run();
For a full walkthrough, see Example: Use OpenTelemetry with OTLP and the standalone Aspire Dashboard.
View metrics in Grafana with OpenTelemetry and Prometheus
To see how to connect an example app with Prometheus and Grafana, follow the walkthrough in Using OpenTelemetry with Prometheus, Grafana, and Jaeger.
In order to stress HttpClient by sending parallel requests to various endpoints, extend the example app with the following endpoint:
app.MapGet("/ClientStress", async Task<string> (ILogger<Program> logger, HttpClient client) =>
{
    string[] uris = ["http://example.com", "http://httpbin.org/get", "https://example.com", "https://httpbin.org/get"];
    await Parallel.ForAsync(0, 50, async (_, ct) =>
    {
        string uri = uris[Random.Shared.Next(uris.Length)];

        try
        {
            await client.GetAsync(uri, ct);
            logger.LogInformation($"{uri} - done.");
        }
        catch { logger.LogInformation($"{uri} - failed."); }
    });
    return "Sent 50 requests to example.com and httpbin.org.";
});
Create a Grafana dashboard by selecting the + icon on the top toolbar then selecting Dashboard. In the dashboard editor that appears, enter Open HTTP/1.1 Connections in the Title box and the following query in the PromQL expression field:
sum by(http_connection_state) (http_client_open_connections{network_protocol_version="1.1"})
Select Apply to save and view the new dashboard. It displays the number of active vs idle HTTP/1.1 connections in the pool.

Enrichment
Enrichment is the addition of custom tags (also known as attributes or labels) to a metric. This is useful if an app wants to add a custom categorization to dashboards or alerts built with metrics.
The http.client.request.duration instrument supports enrichment by registering callbacks with the HttpMetricsEnrichmentContext.
Note that this is a low-level API and a separate callback registration is needed for each HttpRequestMessage.
A simple way to do the callback registration at a single place is to implement a custom DelegatingHandler. This allows you to intercept and modify the requests before they're forwarded to the inner handler and sent to the server:
using System.Net.Http.Metrics;

using HttpClient client = new(new EnrichmentHandler() { InnerHandler = new HttpClientHandler() });

await client.GetStringAsync("https://httpbin.org/response-headers?Enrichment-Value=A");
await client.GetStringAsync("https://httpbin.org/response-headers?Enrichment-Value=B");

sealed class EnrichmentHandler : DelegatingHandler
{
    protected override Task<HttpResponseMessage> SendAsync(HttpRequestMessage request, CancellationToken cancellationToken)
    {
        HttpMetricsEnrichmentContext.AddCallback(request, static context =>
        {
            if (context.Response is not null) // Response is null when an exception occurs.
            {
                // Use any information available on the request or the response to emit custom tags.
                string? value = context.Response.Headers.GetValues("Enrichment-Value").FirstOrDefault();
                if (value != null)
                {
                    context.AddCustomTag("enrichment_value", value);
                }
            }
        });
        return base.SendAsync(request, cancellationToken);
    }
}
If you're working with IHttpClientFactory, you can use AddHttpMessageHandler to register the EnrichmentHandler:
using Microsoft.Extensions.DependencyInjection;
using Microsoft.Extensions.Options;
using System.Net.Http.Metrics;

ServiceCollection services = new();
services.AddHttpClient(Options.DefaultName).AddHttpMessageHandler(() => new EnrichmentHandler());

ServiceProvider serviceProvider = services.BuildServiceProvider();
HttpClient client = serviceProvider.GetRequiredService<HttpClient>();

await client.GetStringAsync("https://httpbin.org/response-headers?Enrichment-Value=A");
await client.GetStringAsync("https://httpbin.org/response-headers?Enrichment-Value=B");
Note
For performance reasons, the enrichment callback is only invoked when the http.client.request.duration instrument is enabled, meaning that something should be collecting the metrics.
This can be dotnet-monitor, Prometheus exporter, a MeterListener, or a MetricCollector<T>.
IMeterFactory and IHttpClientFactory integration
HTTP metrics were designed with isolation and testability in mind. These aspects are supported by the use of IMeterFactory, which enables publishing metrics by a custom Meter instance in order to keep Meters isolated from each other.
By default, a global Meter is used to emit all metrics. This Meter internal to the System.Net.Http library. This behavior can be overridden by assigning a custom IMeterFactory instance to SocketsHttpHandler.MeterFactory or HttpClientHandler.MeterFactory.
Note
The Meter.Name is System.Net.Http for all metrics emitted by HttpClientHandler and SocketsHttpHandler.
When working with Microsoft.Extensions.Http and IHttpClientFactory on .NET 8+, the default IHttpClientFactory implementation automatically picks the IMeterFactory instance registered in the IServiceCollection and assigns it to the primary handler it creates internally.
Note
Starting with .NET 8, the AddHttpClient method automatically calls AddMetrics to initialize the metrics services and register the default IMeterFactory implementation with IServiceCollection. The default IMeterFactory caches Meter instances by name, meaning that there's one Meter with the name System.Net.Http per IServiceCollection.
Test metrics
The following example demonstrates how to validate built-in metrics in unit tests using xUnit, IHttpClientFactory, and MetricCollector<T> from the Microsoft.Extensions.Diagnostics.Testing NuGet package:
[Fact]
public async Task RequestDurationTest()
{
    // Arrange
    ServiceCollection services = new();
    services.AddHttpClient();
    ServiceProvider serviceProvider = services.BuildServiceProvider();
    var meterFactory = serviceProvider.GetService<IMeterFactory>();
    var collector = new MetricCollector<double>(meterFactory,
        "System.Net.Http", "http.client.request.duration");
    var client = serviceProvider.GetRequiredService<HttpClient>();

    // Act
    await client.GetStringAsync("http://example.com");

    // Assert
    await collector.WaitForMeasurementsAsync(minCount: 1).WaitAsync(TimeSpan.FromSeconds(5));
    Assert.Collection(collector.GetMeasurementSnapshot(),
        measurement =>
        {
            Assert.Equal("http", measurement.Tags["url.scheme"]);
            Assert.Equal("GET", measurement.Tags["http.request.method"]);
        });
}
Metrics vs. EventCounters
Metrics are more feature-rich than EventCounters, most notably because of their multi-dimensional nature. This multi-dimensionality lets you create sophisticated queries in tools like Prometheus and get insights on a level that's not possible with EventCounters.
Nevertheless, as of .NET 8, only the System.Net.Http and the System.Net.NameResolutions components are instrumented using Metrics, meaning that if you need counters from the lower levels of the stack such as System.Net.Sockets or System.Net.Security, you must use EventCounters.
Moreover, there are some semantic differences between Metrics and their matching EventCounters.
For example, when using HttpCompletionOption.ResponseContentRead, the current-requests EventCounter considers a request to be active until the moment when the last byte of the request body has been read.
Its metrics counterpart http.client.active_requests doesn't include the time spent reading the response body when counting the active requests.
Need more metrics?
If you have suggestions for other useful information that could be exposed via metrics, create a dotnet/runtime issue.