What are calculated measures?
This article explains calculated measures and how they can be used to perform calculations without modifying dataset queries.
Overview
In AI/BI dashboards, visualizations are based on datasets defined in the Data tab. Calculated measures provide a way to create and visualize new data fields without altering the original dataset. For example, in a sales dataset that includes item, region, price, and cost data, you might want to calculate and visualize the profit margin for each region.
The following table shows an example starting dataset:
| Item | Region | Price | Cost |
|---|---|---|---|
| Apples | USA | 30 | 15 |
| Apples | Canada | 20 | 10 |
| Oranges | USA | 20 | 15 |
| Oranges | Canada | 15 | 10 |
Without calculated measures, adding a profit margin would require creating a new dataset with an additional margin column. The following table shows the resulting dataset:
| Region | Margin |
|---|---|
| USA | 0.40 |
| Canada | 0.43 |
While this approach works, the new dataset is static and might only support a single visualization. Filters applied to the original dataset do not affect the new dataset without additional manual adjustments. Using a calculated measure instead, you can retain the original dataset and define a formula to compute the profit margin dynamically.
The following example formula calculates the profit margin based on aggregated price and cost values:
(SUM(Price) - SUM(Cost)) / SUM(Price)
The resulting calculated measure can be used in dashboard visualizations. If a filter is applied to the dataset using a widget on the canvas, charts that use the calculated measure are automatically updated to reflect the filtered data.
Create a calculated measure
This example creates a calculated measure based on the samples.nyctaxi.trips dataset. It assumes general knowledge about how to work with AI/BI dashboards. If you are unfamiliar with authoring AI/BI dashboards, see Create a dashboard to get started.
- From the Data tab, create a dataset using the following statement:
SELECT * FROM samples.nyctaxi.trips
Rename the dataset Taxicab data.
Click Calculated Measure.
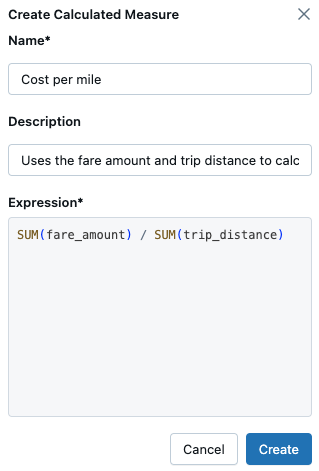
A Create Calculated Measure panel opens on the right side of the screen. In the Name text field, enter Cost per mile.
(Optional) In the Description text field, enter “Uses the fare amount and trip distance to calculate cost per mile.”
In the Expression field, enter
SUM(fare_amount) / SUM(trip_distance).Click Create.
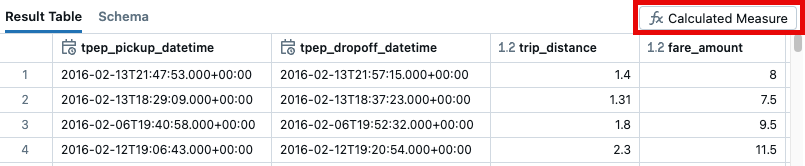
Click the Schema tab in the results panel to view the calculated measure and its associated comment. Calculated measures are listed in the Measures section and marked by a ![]() fx. The value associated with a calculated measure is dynamically calculated when you set the
fx. The value associated with a calculated measure is dynamically calculated when you set the GROUP BY in a visualization. You cannot see the value in the results table.

Use a calculated measure in a visualization
You can use the previously created Cost per mile measure in a visualization.
- Click Canvas. Then, place a new visualization widget on the canvas.
- Use the visualization configuration panel to edit the settings as follows:
- Dataset: Taxicab data
- Visualization: Bar
- X axis:
- Field: dropoff_zip
- Scale Type: Categorical
- Transform: None
- Y axis:
- Cost per mile
Note
Calculated measures cannot be used with table visualizations.
The following image shows the chart.
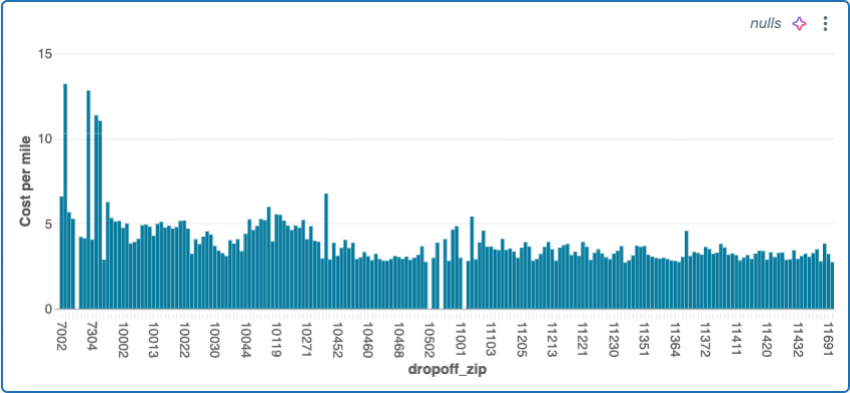
Visualizations that include calculated measures dynamically update based on applied filters. For example, if you add a filter for pickup_zip to the canvas and select a filter value, the visualization updates to display the cost per mile metric only for trips originating from the selected filter value. The resulting bar chart reflects the filtered data accordingly.
Edit a calculated measure
To edit a measure:
- Click the Data tab and then click the dataset associated with the measure you want to edit.
- Click the Schema tab in the results panel.
- The Measures section appears under the list of fields. Click the
 kebab menu to the right of the measure you want to edit. Then, click Edit.
 - In the Edit calculated measure panel, update the text fields that you want to edit. Then, click Update.
Delete a calculated measure
To delete a measure:
- Click the Data tab and then click the dataset associated with the measure you want to edit.
- Click the Schema tab in the results panel.
- The Measures section appears under the list of fields. Click the kebab menu to the right of the measure you want to edit. Then, click Delete.
- Click Delete in the Delete dialog that appears.
Limitations
To use calculated measures, the following must be true:
- The result of the SQL expression must be aggregated.
- Columns used in the expression must belong to the same dataset.
- The expression cannot include calls to external tables or data sources.
Supported functions
The following tables list supported functions. Attempting to use an unsupported function results in an error.
Aggregate functions
All calculated measures must be aggregated. The following aggregation operations are supported:
| Aggregation | Description |
|---|---|
| avg(expr) or mean(expr) | Returns the calculated mean in a column or expression |
| count(*) | Returns the number of rows in a group |
| count(DISTINCT expr) | Returns the number of unique rows in a group |
| sum(expr) | Returns the total of values in a column or expression |
| max(expr) | Returns the maximum value in a column or expression |
| min(expr) | Returns the minimum value in a column or expression |
| percentile(expr, percentage [,frequency]) | Returns the exact percentile value of expr at the specified percentage in a group |
| first(expr [,ignoreNull]) | Returns the first value of expr for a group |
| last(expr [,ignoreNull]) | Returns the last value of expr for the group |
Arithmetic operations
You can combine expressions with the following arithmetic operations:
| Expression | Description |
|---|---|
| expr1 + expr2 | Returns the sum of expr1 and expr2. |
| expr1 - expr2 | Returns the difference when subtracting expr2 from expr1. |
| multiplier * multiplicand | Returns the product of two expressions. |
| dividend / divisor | Returns the result of dividing the dividend by the divisor. |
| - expr | Returns the negated value of the expression. |
| + expr | Returns the value of the expression. |
| try_add(expr1, expr2) | Adds two values. If an error occurs, returns NULL. |
| try_subtract(expr1, expr2) | Subtracts expr2 from expr1. If an error occurs, returns NULL. |
| try_multiply(multiplier, multiplicand) | Multiplies two numbers. If an error occurs, returns NULL. |
| try_divide(dividend, divisor) | Divides the dividend by the divisor. If an error occurs, returns NULL. |