Troubleshoot with resource logs
This how-to guide provides an overview of Azure Web PubSub resource logs and tips for using the logs to troubleshoot problems. You can use logs for issue identification, connection tracking, message tracing, HTTP request tracing, and analysis.
What are resource logs?
There are three types of resource logs:
- Connectivity logs provide detailed information for Azure Web PubSub hub connections. They might include basic information like user ID and connection ID, or event information like connect and disconnect.
- Messaging logs provide tracing information for hub messages that are sent or received via the Azure Web PubSub service, like the tracing ID or message type.
- HTTP request logs provide tracing information for HTTP requests to the Azure Web PubSub service, like HTTP method or status code. Typically, an HTTP request is recorded when it arrives at or leaves from the service.
Capture resource logs by using the live trace tool
The live trace tool in the Azure Web PubSub service can collect resource logs in real time, which is helpful for troubleshooting problems in your development environment. The live trace tool can capture connectivity logs, messaging logs, and HTTP request logs.
You should consider the following factors when using the live trace tool:
- The real-time resource logs that the live trace tool captures are billed as messages (outbound traffic).
- The Free tier instance of the Azure Web PubSub service has a daily limit of 20,000 messages (outbound traffic). You can unexpectedly reach the daily limit by using live trace.
- The live trace tool doesn't currently support Microsoft Entra authorization. You must enable access keys to use live trace. Under Settings, select Keys, and then enable Access Key.
Launch the live trace tool
When you enable an access key, you use the access token to authenticate the live trace tool. Otherwise, you use Microsoft Entra ID to authenticate the live trace tool. You can find out if the access key is enabled by going to the Keys pane in your Azure SignalR Service instance in the Azure portal.
Open the live trace when the access key is enabled
Go to the Azure portal and your SignalR Service pane.
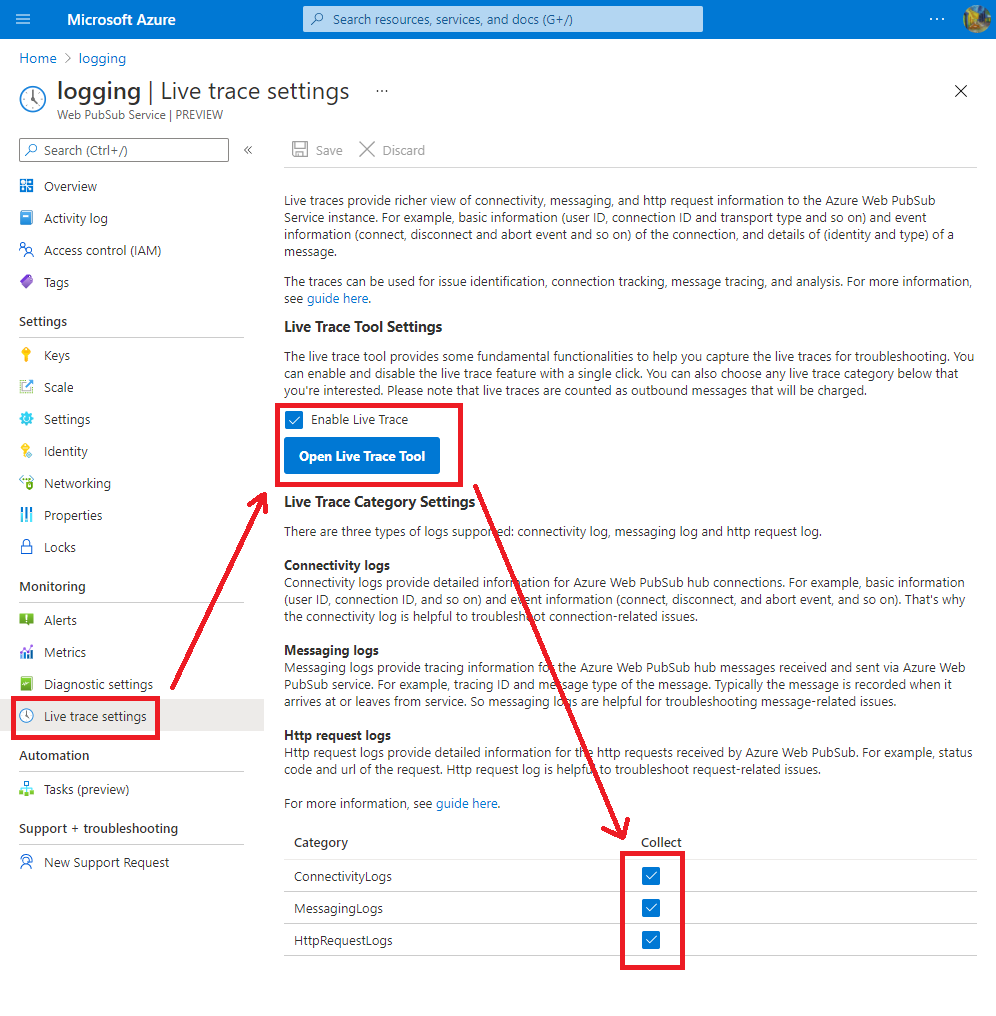
On the service menu, under Monitoring, select Live trace settings.
Select Enable Live Trace.
Select the Save button. It takes a moment for the changes to take effect.
When updating is complete, select Open Live Trace Tool.
Open the live trace tool when the access key is disabled
Assign live trace tool API permission to yourself
Go to the Azure portal and your SignalR Service pane.
Select Access control (IAM).
Select +Add and then select Role assignment.
On the Job function roles tab, select the SignalR Service Owner role, and then select Next.
On the Members pane, click +Select members.
Search and select members, and then click Select.
Select Review + assign and wait for the completion notification.
Enable the live trace tool
Go to the Azure portal and your SignalR Service pane.
From the service menu, under Monitoring, select Live trace settings.
Select Enable Live Trace.
Select the Save button. It takes a moment for the changes to take effect.
When updating is complete, select Open Live Trace Tool.
Sign in with your Microsoft account
The live trace tool causes a Microsoft sign-in window to open. If no window opens, allow pop-up windows in your browser settings.
Wait for Ready to appear on the status bar.
Capture the resource logs
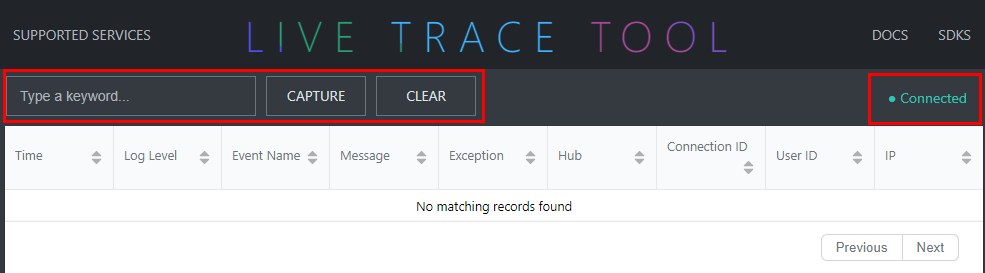
The live trace tool can help you capture the resource logs for troubleshooting.
- Capture begins to capture the real-time resource logs from Azure Web PubSub.
- Clear clears the captured real-time resource logs.
- Log filter filters the captured real-time resource logs with one specific keyword. The common separators like space, comma, and semicolon are treated as part of the keyword.
- Status shows whether the live trace tool is connected or disconnected with the specific instance.
The real-time resource logs captured by the live trace tool contain detailed information for troubleshooting.
| Name | Description |
|---|---|
| Time | Log event time |
| Log Level | Log event level (Trace, Debug, Informational, Warning or Error) |
| Event Name | Operation name of the event |
| Message | Detailed message for the event |
| Exception | Runtime exception of the Azure Web PubSub service |
| Hub | User-defined hub name |
| Connection ID | Identity of the connection |
| User ID | User identity |
| IP | Client IP address |
| Route Template | Route template of the API |
| HTTP Method | HTTP method (POST, GET, PUT or DELETE) |
| URL | Uniform resource locator |
| Trace ID | Unique identifier to the invocation |
| Status Code | HTTP response code |
| Duration | Duration between receiving the request and processing the request |
| Headers | Additional information passed by the client and the server with an HTTP request or response |
Capture resource logs with Azure Monitor
Enable resource logs
Currently, Azure Web PubSub supports integration with Azure Storage.
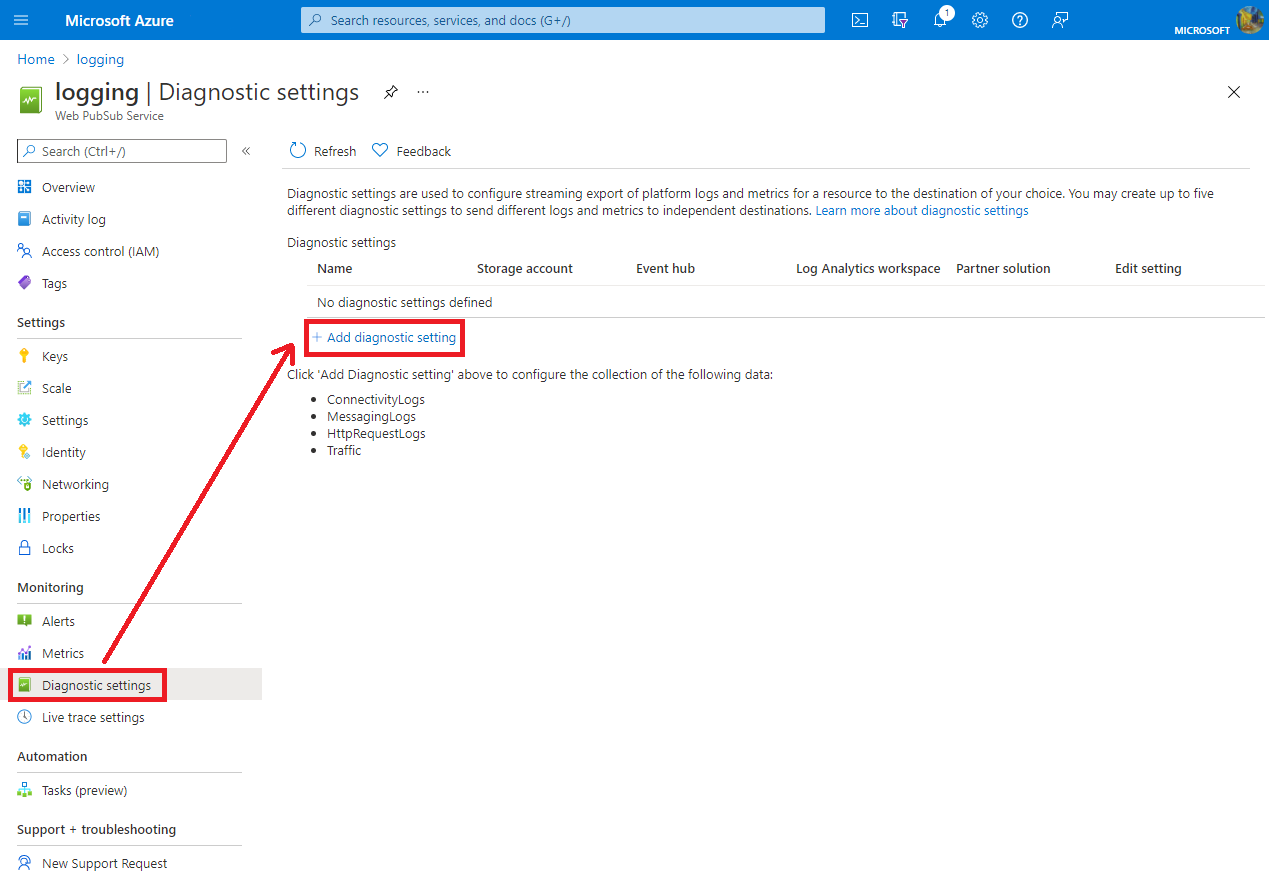
Go to the Azure portal.
On the Diagnostic settings pane of your Azure Web PubSub service instance, select + Add diagnostic setting.
In Diagnostic setting name, enter the setting name.
In Category details, select any log category you need.
In Destination details, select Archive to a storage account.
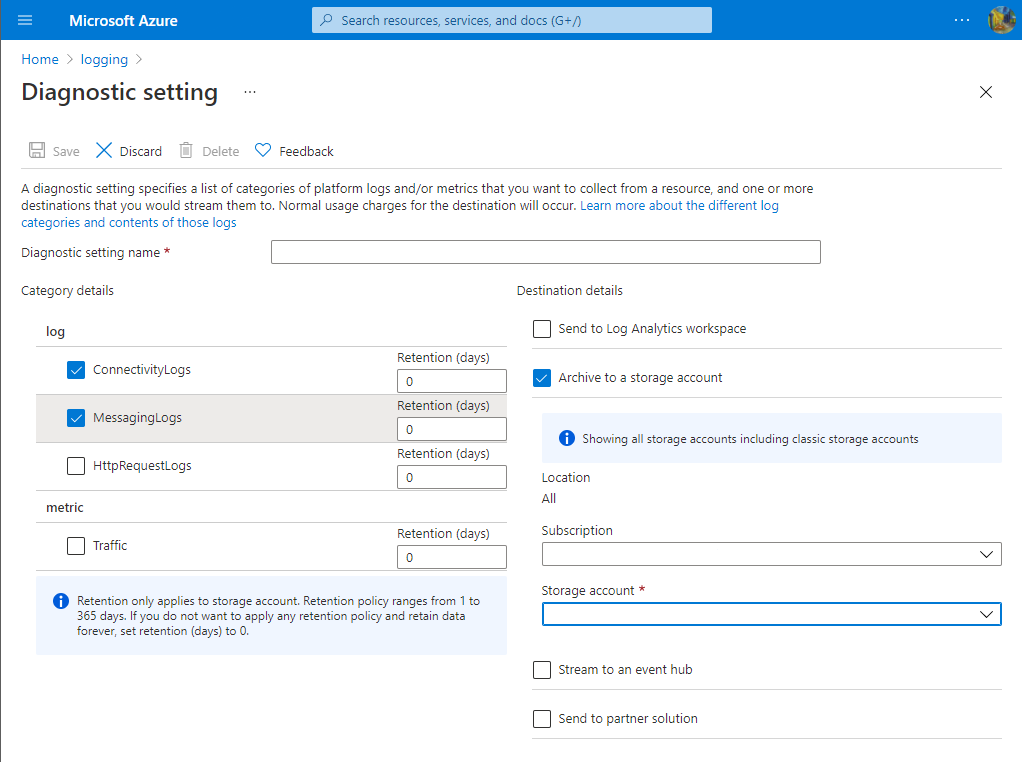
Select Save to save the diagnostic setting.
Note
The storage account should be in the same region as the Azure Web PubSub service.
Archive to an Azure storage account
Logs are stored in the storage account configured on the Diagnostics setting pane. A container named insights-logs-<CATEGORY_NAME> is automatically created to store resource logs. Inside the container, logs are stored in the file resourceId=/SUBSCRIPTIONS/XXXXXXXX-XXXX-XXXX-XXXX-XXXXXXXXXXXX/RESOURCEGROUPS/XXXX/PROVIDERS/MICROSOFT.SIGNALRSERVICE/SIGNALR/XXX/y=YYYY/m=MM/d=DD/h=HH/m=00/PT1H.json. The path is combined by resource ID and Date Time. The log files are split by hour. The minute value is always m=00.
All logs are stored in JavaScript Object Notation (JSON) format. Each entry has string fields that use the format described in the following sections.
JSON strings in archive logs include elements listed in the following tables.
Format
| Name | Description |
|---|---|
time |
Log event time |
level |
Log event level |
resourceId |
Resource ID of your Azure SignalR Service instance |
location |
Location of your Azure SignalR Service instance |
category |
Category of the log event |
operationName |
Operation name of the event |
callerIpAddress |
IP address of your server or client |
properties |
Detailed properties related to this log event (see following table) |
Properties table
| Name | Description |
|---|---|
collection |
Collection of the log event (Connection, Authorization or Throttling) |
connectionId |
Identity of the connection |
userId |
Identity of the user |
message |
Detailed message of log event |
hub |
User-defined hub name |
routeTemplate |
Route template of the API |
httpMethod |
HTTP method (POST, GET, PUT or DELETE) |
url |
Uniform resource locator |
traceId |
Unique identifier to the invocation |
statusCode |
HTTP response code |
duration |
Duration of time between when the request is received and processed |
headers |
Additional information passed by the client and the server with an HTTP request or response |
The following code is an example of a JSON string in an archive log:
{
  "properties": {
    "message": "Connection started",
    "collection": "Connection",
    "connectionId": "LW61bMG2VQLIMYIVBMmyXgb3c418200",
    "userId": null
  },
  "operationName": "ConnectionStarted",
  "category": "ConnectivityLogs",
  "level": "Informational",
  "callerIpAddress": "167.220.255.79",
  "resourceId": "/SUBSCRIPTIONS/XXXXXXXX-XXXX-XXXX-XXXX-XXXXXXXXXXXX/RESOURCEGROUPS/MYGROUP/PROVIDERS/MICROSOFT.SIGNALRSERVICE/WEBPUBSUB/MYWEBPUBSUB",
  "time": "2021-09-17T05:25:05Z",
  "location": "westus"
}
Archive to Azure Log Analytics
To send logs to a Log Analytics workspace:
On the Diagnostic setting pane, under Destination details, select Send to Log Analytics workspace.
For Subscription, select the subscription that you want to use.
For the destination for the logs, select Log Analytics workspace.
To view the resource logs, follow these steps:
Select Logs in your target Log Analytics workspace.
To query the log, enter
WebPubSubConnectivity,WebPubSubMessaging, orWebPubSubHttpRequest, and then select the time range. For advanced queries, see Get started with Log Analytics in Azure Monitor.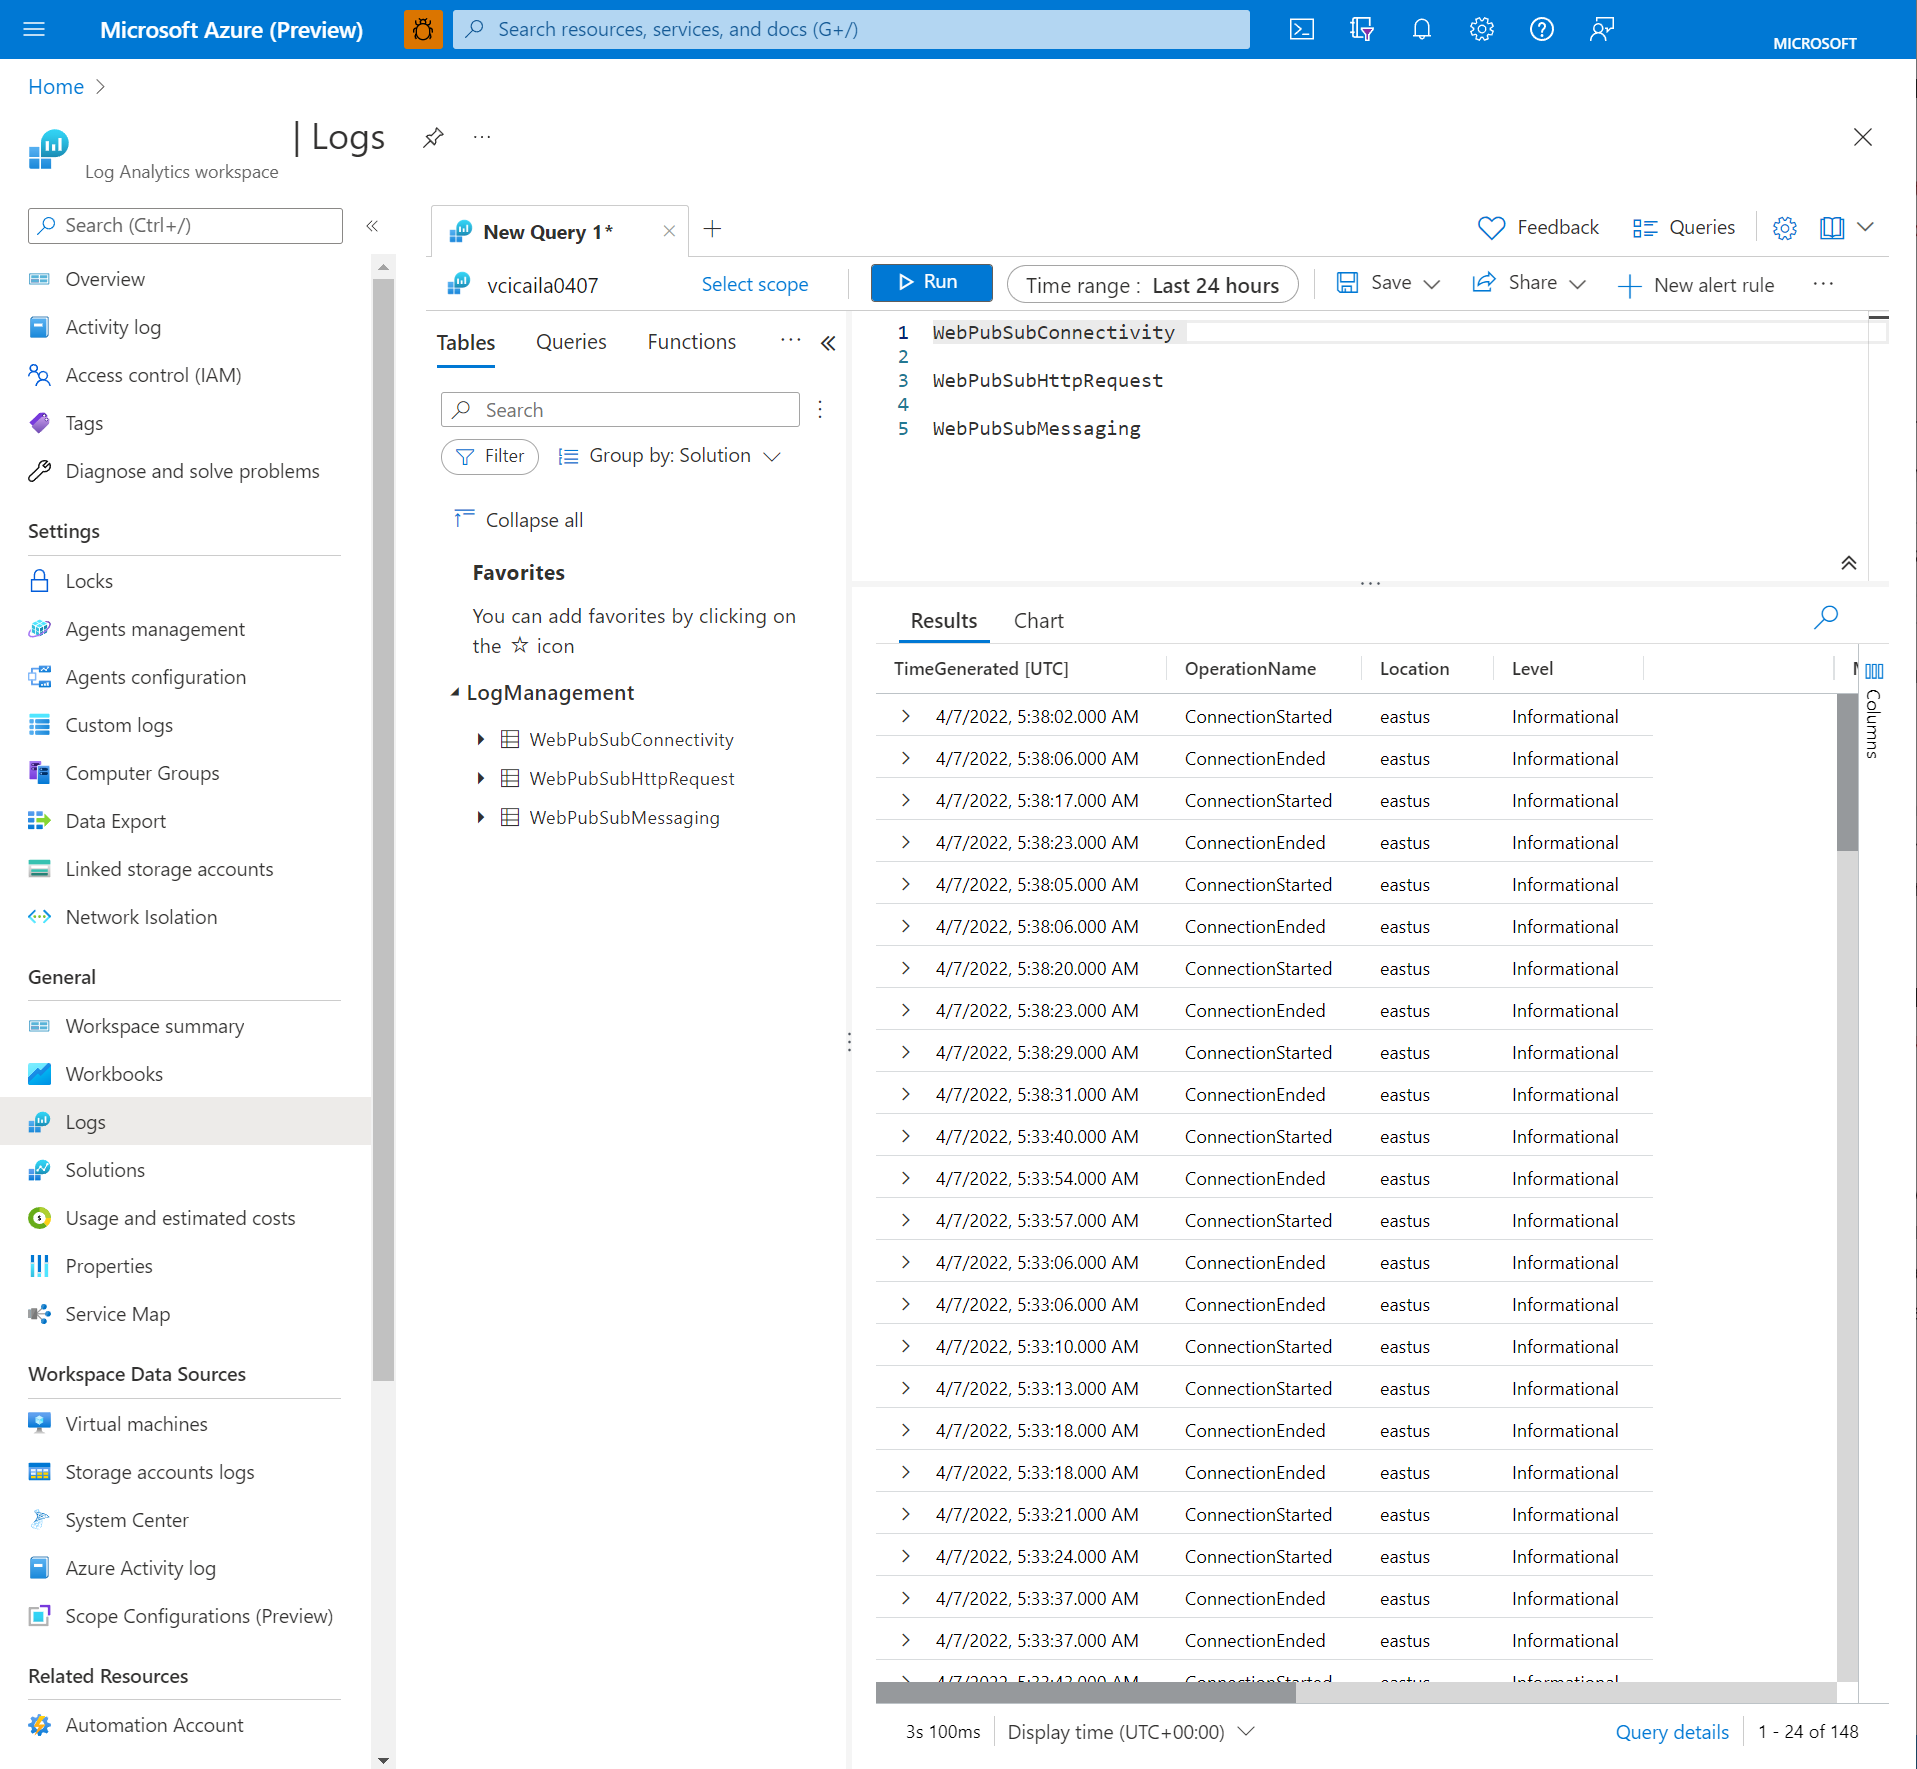


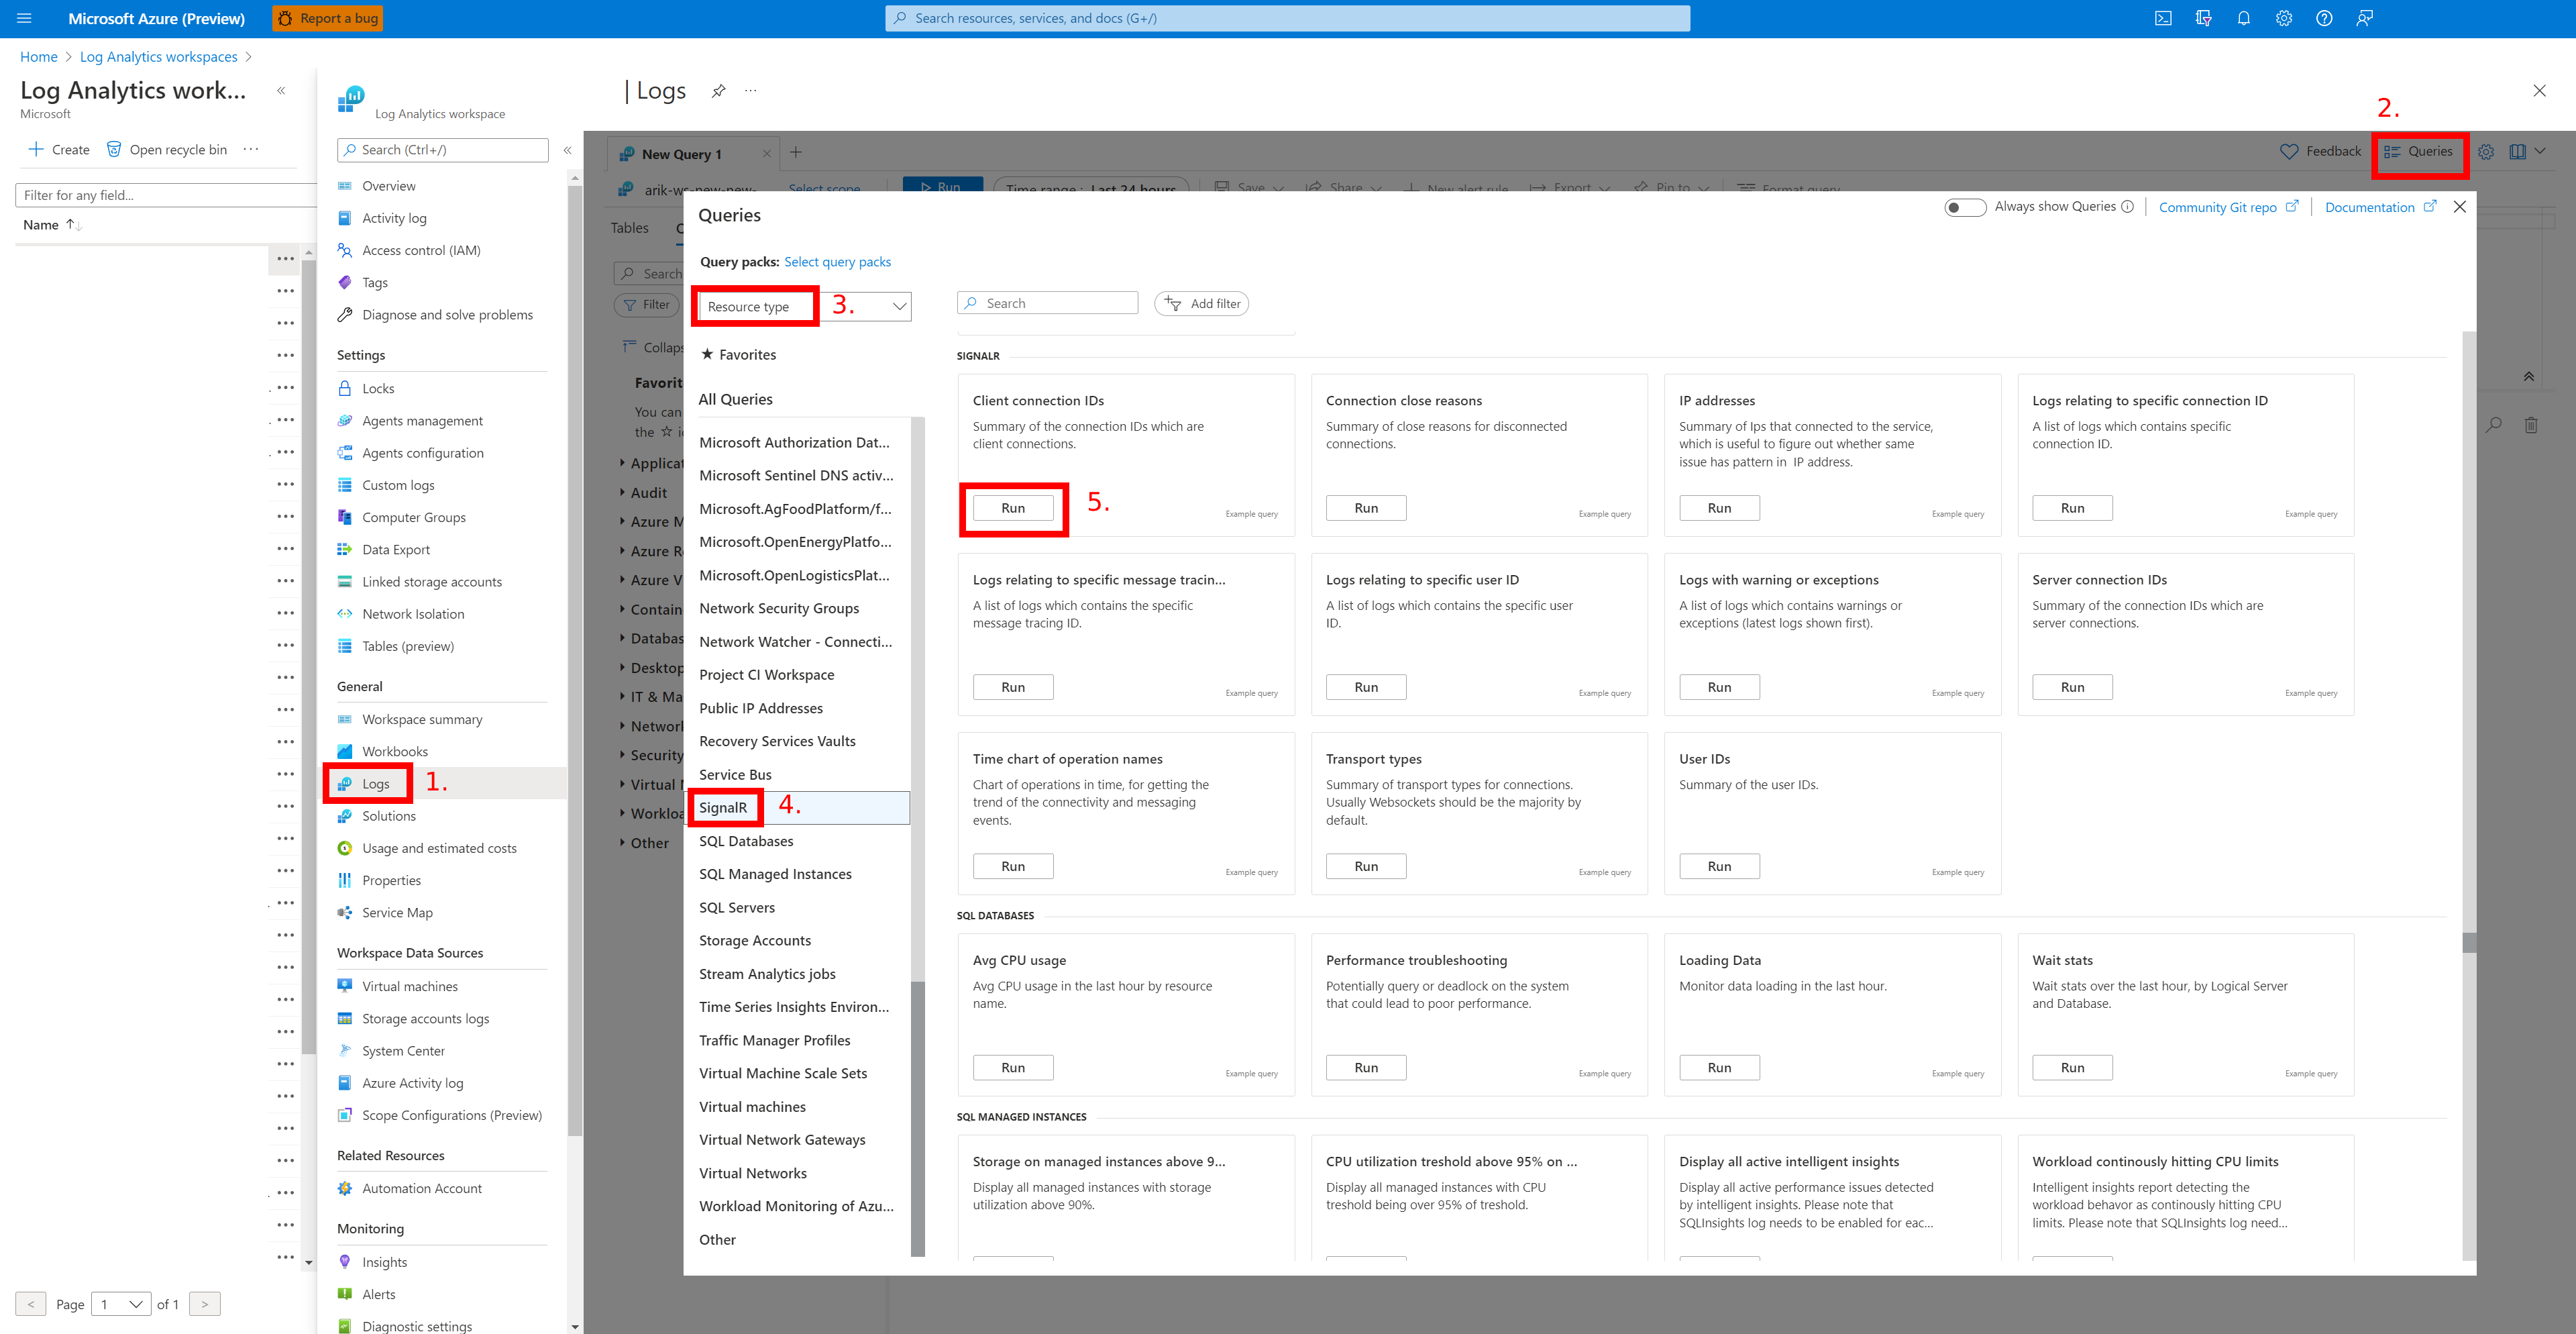
To use a sample query for SignalR service, follow these steps:
Select Logs in your target Log Analytics workspace.
Select Queries to open the query explorer.
Select Resource type to group sample queries by resource type.
Select Run to run the script.

Archive log columns include elements listed in the following table.
| Name | Description |
|---|---|
TimeGenerated |
Log event time |
Collection |
Collection of the log event (Connection, Authorization, and Throttling) |
OperationName |
Operation name of the event |
Location |
Location of your Azure SignalR Service instance |
Level |
Log event level |
CallerIpAddress |
IP address of your server/client |
Message |
Detailed message of log event |
UserId |
Identity of the user |
ConnectionId |
Identity of the connection |
ConnectionType |
Type of the connection (Server, a connection from the server side; and Client, a connection from the client side) |
TransportType |
Transport type of the connection (Websockets, ServerSentEvents, and LongPolling) |
Use resource logs to troubleshoot
If you find unexpected increases or decreases in the number of connections, you can troubleshoot the problem by using resource logs. Potential problems include unexpected connection quantity changes, connections reaching connection limits, and authorization failure.
Unexpected disconnection events
If a connection disconnects, the resource logs record the disconnection event with ConnectionAborted or ConnectionEnded in operationName.
The difference between ConnectionAborted and ConnectionEnded is that ConnectionEnded is an expected disconnection that's triggered by the client or server side. By contrast, ConnectionAborted usually refers to an event in which a connection unexpectedly drops, and the reason for disconnection is provided in message.
The following table lists reasons for an unexpected disconnection.
| Reason | Description |
|---|---|
| Connection count reaches limit | The connection count reaches the limit of your current price tier. Consider scaling up the service unit. |
| Service reloading, reconnect | The Azure Web PubSub service is reloading. You need to implement your own reconnect mechanism or manually reconnect to the Azure Web PubSub service. |
| Internal server transient error | A transient error occurs in the Azure Web PubSub service. Recovery should be automatic. |
Unexpected increase in connections
When the number of client connections unexpectedly increases, you should follow these steps. First, filter out the superfluous connections and add a unique test user ID to your test client connection. Then, check the resource logs. If you notice that more than one client connection has the same test user ID or IP, it's likely that the client is creating more connections than expected. Check your client code to find the source of the extra connections.
Authorization failure
If you get 401 Unauthorized returned for client requests, check your resource logs. If you find Failed to validate audience. Expected Audiences: <valid audience>. Actual Audiences: <actual audience>, it means all audiences in your access token are invalid. Try using the valid audiences suggested in the log.
Throttling
If you find that you can't establish client connections to the Azure Web PubSub service, check your resource logs. If you see Connection count reaches limit in the resource log, you established too many connections to the Azure Web PubSub service and reached the connection count limit. Consider scaling up your Azure Web PubSub service instance.
If you see Message count reaches limit in the resource log and you're using the Free tier, it means you used up the quota of messages. If you want to send more messages, consider changing your Azure Web PubSub service instance to Standard tier. For more information, see Azure Web PubSub pricing.