Tracing using Application Insights
Determining the reasoning behind your agent's executions is important for troubleshooting and debugging. However, it can be difficult for complex agents for a number of reasons:
- There could be a high number of steps involved in generating a response, making it hard to keep track of all of them.
- The sequence of steps might vary based on user input.
- The inputs/outputs at each stage might be long and deserve more detailed inspection.
- Each step of an agent's runtime might also involve nesting. For example, an agent might invoke a tool, which uses another process, which then invokes another tool. If you notice strange or incorrect output from a top-level agent run, it might be difficult to determine exactly where in the execution the issue was introduced.
Tracing solves this by allowing you to clearly see the inputs and outputs of each primitive involved in a particular agent run, in the order in which they were invoked.
Creating an Application Insights resource
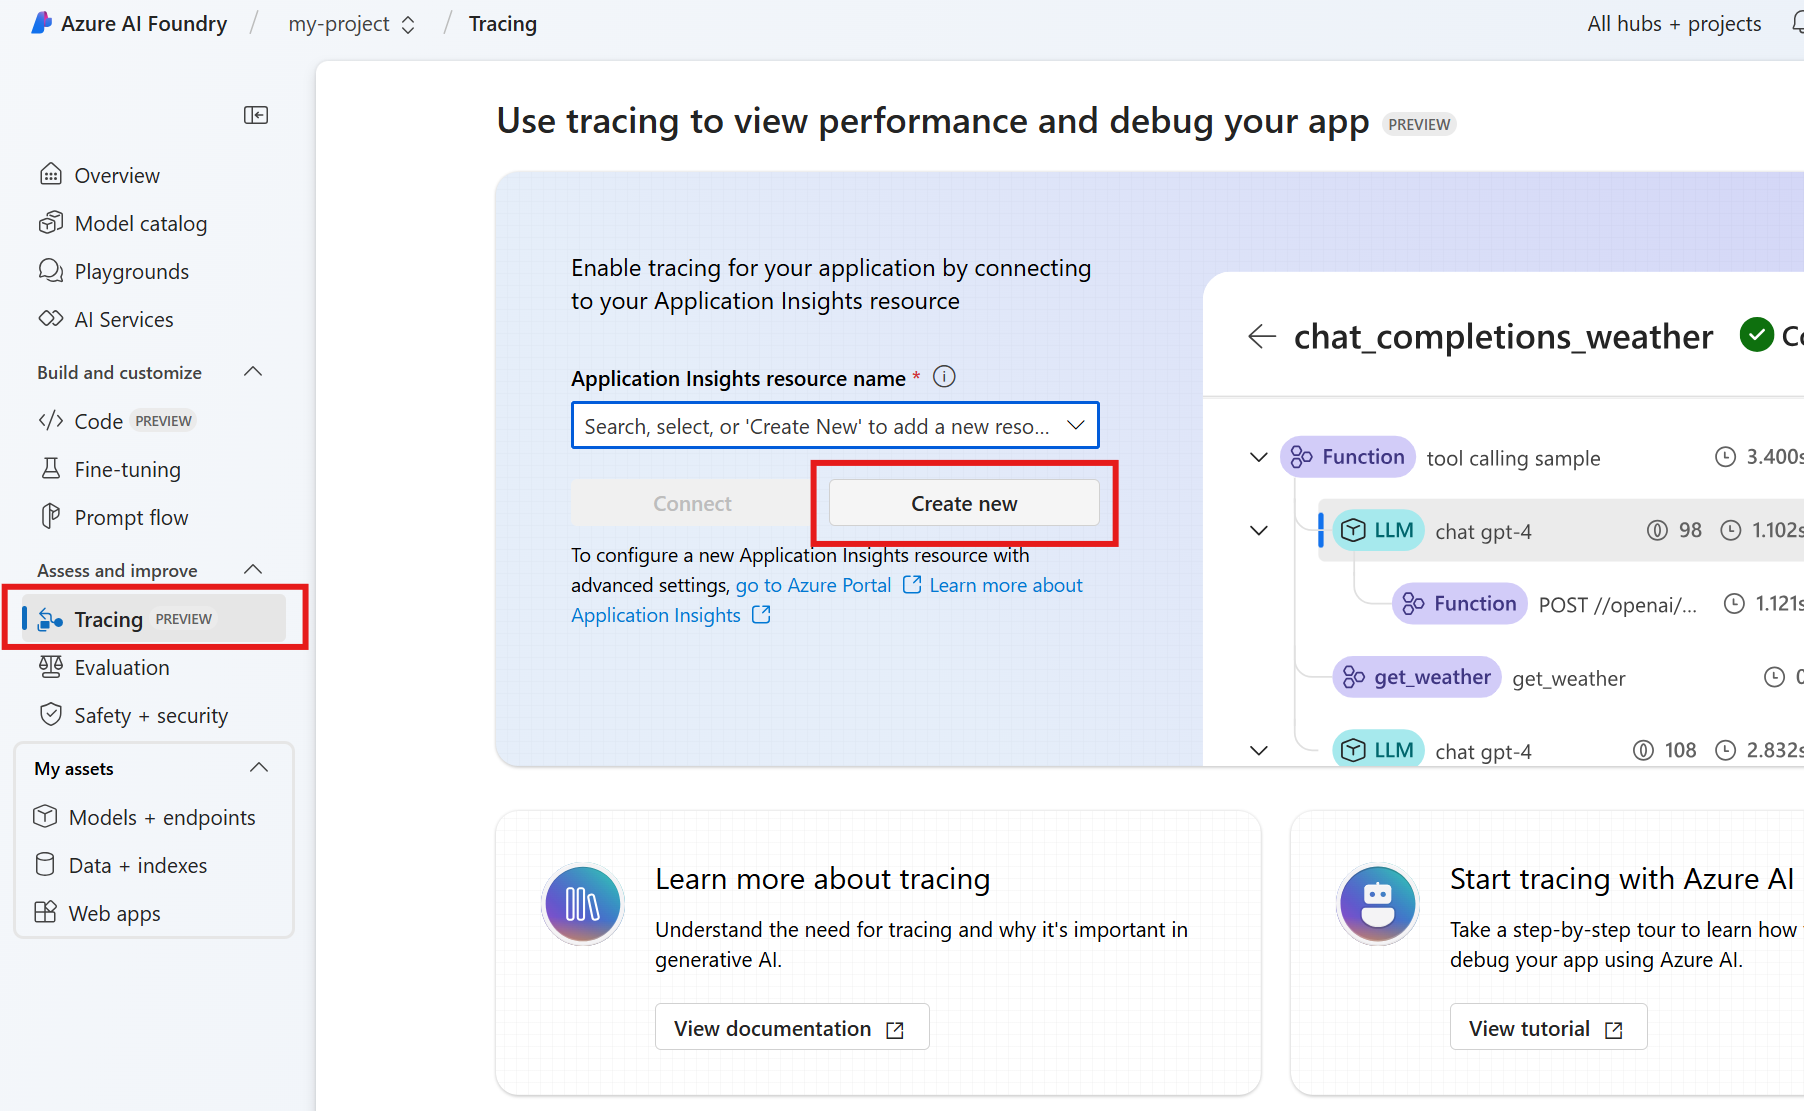
Tracing lets you analyze your agent's performance and behavior by using OpenTelemetry and adding an Application Insights resource to your Azure AI Foundry project.
To add an Application Insights resource, navigate to the Tracing tab in the Azure AI Foundry portal, and create a new resource if you don't already have one.
Once created, you can get an Application Insights connection string, configure your agents, and observe the full execution path of your agent through Azure Monitor. Typically you want to enable tracing before you create an agent.
Trace an agent
First, use pip install to install OpenTelemetry and the Azure SDK tracing plugin.
pip install opentelemetry
pip install azure-core-tracing-opentelemetry
You will also need an exporter to send results to your observability backend. You can print traces to the console or use a local viewer such as Aspire Dashboard. To connect to Aspire Dashboard or another OpenTelemetry compatible backend, install the OpenTelemetry Protocol (OTLP) exporter.
pip install opentelemetry-exporter-otlp
Once you have the packages installed, you can use one the following Python samples to implement tracing with your agents. Samples that use console tracing display the results locally in the console. Samples that use Azure Monitor send the traces to the Azure Monitor in the Azure AI Foundry portal, in the Tracing tab in the left navigation menu for the portal.
Note
There is a known bug in the agents tracing functionality. The bug will cause the agent's function tool to call related info (function names and parameter values, which could contain sensitive information) to be included in the traces even when content recording is not enabled.
Using Azure Monitor
Using console tracing
